

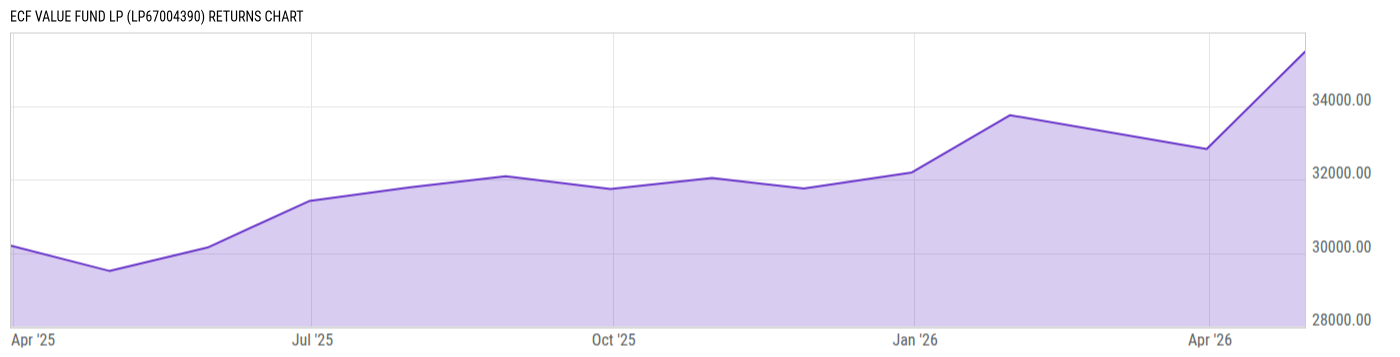
ECF Value Fund LP (LP67004390)
35475.07
+2646.02
(+8.06%)
USD |
Apr 30 2026
Returns Chart
Key Stats
| Net Expense Ratio | Total Assets Under Management | Weighted Average Dividend Yield | Turnover Ratio (Generic) |
|---|---|---|---|
| -- | 566.30M | -- | -- |
| 1 Year Fund Level Flows | 1 Year Total Returns (Daily) | Annualized Total Returns Since Inception (Daily) | Max Drawdown (Since Inception) |
| -29.84M | 20.20% |
Basic Info
| Investment Strategy | |
| The Fund seeks to buy securities which trade at a discount to the Investment Adviser's view of their intrinsic value and to short securities that trade above the Investment Adviser's view of their intrinsic value. Importantly, the Fund invests in situations where a reason for a valuation discrepancy can be discerned and is deemed temporary. The portfolio typically holds 30-40 positions, including equity long/short (40-60% net), and debt securities (30-50%). |
| General | |
| Security Type | Hedge Fund |
| Equity Style | -- |
| Broad Asset Class | Alternative |
| Broad Category | Alternative Strategies |
| Global Peer Group | Hedge/Event Driven |
| Peer Group | -- |
| Global Macro | Hedge Funds |
| US Macro | -- |
| YCharts Categorization | -- |
| YCharts Benchmark | -- |
| Prospectus Objective | -- |
| Fund Owner Firm Name | Gates Capital |
| Broad Asset Class Benchmark Index | |
| ^MSACWINTR | 100.0% |
Net Fund Flows Versus Peer Group
1 Month
% Rank:
--
--
Peer Group Low
--
Peer Group High
1 Year
% Rank:
--
-29.84M
--
Peer Group Low
--
Peer Group High
3 Months
% Rank:
--
--
Peer Group Low
--
Peer Group High
3 Years
% Rank:
--
--
Peer Group Low
--
Peer Group High
6 Months
% Rank:
--
--
Peer Group Low
--
Peer Group High
5 Years
% Rank:
--
--
Peer Group Low
--
Peer Group High
YTD
% Rank:
--
--
Peer Group Low
--
Peer Group High
10 Years
% Rank:
--
--
Peer Group Low
--
Peer Group High
Date Unavailable
Risk
Performance Versus Peer Group
Annual Total Returns Versus Peers
As of June 01, 2026.
Asset Allocation
| Type | % Net |
|---|
Top Holdings
| Name | % Weight | Price | % Change |
|---|---|---|---|
| -- | -- | -- | -- |
| -- | -- | -- | -- |
| -- | -- | -- | -- |
| -- | -- | -- | -- |
| -- | -- | -- | -- |
Fees & Availability
| Fees | |
| Actual 12B-1 Fee | -- |
| Actual Management Fee | -- |
| Administration Fee | -- |
| Maximum Front Load | -- |
| Maximum Deferred Load | -- |
| Maximum Redemption Fee | -- |
| General Availability | |
| Available for Insurance Product | No |
| Available for RRSP | No |
| Purchase Details | |
| Open to New Investors |
|
| Minimum Initial Investment | 1.00M None |
| Minimum Subsequent Investment | 0.00 None |
Basic Info
| Investment Strategy | |
| The Fund seeks to buy securities which trade at a discount to the Investment Adviser's view of their intrinsic value and to short securities that trade above the Investment Adviser's view of their intrinsic value. Importantly, the Fund invests in situations where a reason for a valuation discrepancy can be discerned and is deemed temporary. The portfolio typically holds 30-40 positions, including equity long/short (40-60% net), and debt securities (30-50%). |
| General | |
| Security Type | Hedge Fund |
| Equity Style | -- |
| Broad Asset Class | Alternative |
| Broad Category | Alternative Strategies |
| Global Peer Group | Hedge/Event Driven |
| Peer Group | -- |
| Global Macro | Hedge Funds |
| US Macro | -- |
| YCharts Categorization | -- |
| YCharts Benchmark | -- |
| Prospectus Objective | -- |
| Fund Owner Firm Name | Gates Capital |
| Broad Asset Class Benchmark Index | |
| ^MSACWINTR | 100.0% |
Fundamentals
| General | |
| Distribution Yield | -- |
| Dividend Yield TTM (4-30-26) | 0.00% |
| 30-Day SEC Yield | -- |
| 7-Day SEC Yield | -- |
| Number of Holdings | -- |
Fund Details
| Key Dates | |
| Launch Date | 6/3/1996 |
| Last Annual Report Date | 11/30/2023 |
| Last Prospectus Date | -- |
| Attributes | |
| Index Fund | -- |
| Inverse Fund | No |
| Leveraged Fund |
|
| Fund of Funds | No |
| Currency Hedged Fund | -- |
| Socially Responsible Fund | No |
Top Portfolio Holders
| Name | % Weight |
|---|---|
| Portfolio A | 5.00% |
| Portfolio B | 3.50% |
| Portfolio C | 2.25% |