

JNL Multi-Manager Select Equity Fund I (LP40235619)
20.78
+0.12
(+0.58%)
USD |
May 27 2026
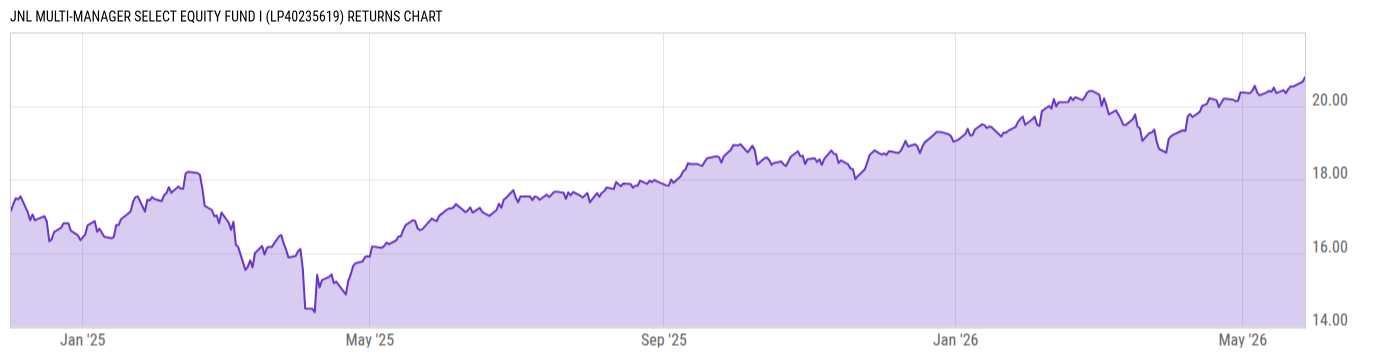
Returns Chart
Key Stats
| Net Expense Ratio | Total Assets Under Management | Weighted Average Dividend Yield | Turnover Ratio (Generic) |
|---|---|---|---|
| 0.68% | 1.539B | 1.62% | 107.0% |
| 1 Year Fund Level Flows | 1 Year Total Returns (Daily) | Annualized Total Returns Since Inception (Daily) | Max Drawdown (Since Inception) |
| 107.34M | 22.67% |
Basic Info
| Investment Strategy | |
| The Fund seeks long-term capital appreciation. The fund will invest at least 80% of its assets, plus any borrowings made for investment in US equity securities which include publicly traded common stocks. Unaffiliated investment managers generally provide day-to-day management for a portion of the Funds assets. |
| General | |
| Security Type | Insurance Fund |
| Equity Style | Multi Cap Core |
| Broad Asset Class | US Equity |
| Broad Category | Equity |
| Global Peer Group | Equity US |
| Peer Group | Large-Cap Core Funds |
| Global Macro | Equity North America |
| US Macro | Large-Cap Funds |
| YCharts Categorization | -- |
| YCharts Benchmark | -- |
| Prospectus Objective | Growth & Income Funds |
| Fund Owner Firm Name | Jackson |
| Broad Asset Class Benchmark Index | |
| ^SPXTR | 100.0% |
Net Fund Flows Versus Peer Group
1 Month
% Rank:
14
-5.233B
Peer Group Low
1.054B
Peer Group High
1 Year
% Rank:
11
107.34M
-16.89B
Peer Group Low
12.11B
Peer Group High
3 Months
% Rank:
11
-9.978B
Peer Group Low
6.056B
Peer Group High
3 Years
% Rank:
8
-30.69B
Peer Group Low
26.39B
Peer Group High
6 Months
% Rank:
23
-12.73B
Peer Group Low
6.056B
Peer Group High
5 Years
% Rank:
4
-56.53B
Peer Group Low
26.35B
Peer Group High
YTD
% Rank:
14
-10.61B
Peer Group Low
6.056B
Peer Group High
10 Years
% Rank:
7
-136.53B
Peer Group Low
26.42B
Peer Group High
Date Unavailable
Risk
Performance Versus Peer Group
Annual Total Returns Versus Peers
As of May 28, 2026.
Asset Allocation
As of March 31, 2026.
| Type | % Net |
|---|---|
| Cash | 4.02% |
| Stock | 95.49% |
| Bond | 0.56% |
| Convertible | 0.00% |
| Preferred | 0.00% |
| Other | -0.07% |
Top 10 Holdings
| Name | % Weight | Price | % Change |
|---|---|---|---|
| Western Digital Corp. | 4.89% | 527.84 | -0.52% |
|
USD Cash
|
3.56% | -- | -- |
| Applovin Corp. | 3.55% | 604.91 | 6.53% |
| Siemens Energy AG | 3.32% | 204.02 | -3.77% |
| Philip Morris International, Inc. | 3.30% | 179.38 | -1.46% |
| NVIDIA Corp. | 2.95% | 214.00 | 0.66% |
| Amazon.com, Inc. | 2.89% | 273.85 | 0.74% |
| Brookdale Senior Living, Inc. | 2.24% | 13.14 | -2.67% |
| AT&T, Inc. | 2.10% | 24.82 | -0.28% |
| Verizon Communications, Inc. | 1.95% | 47.97 | -0.56% |
Fees & Availability
| Fees | |
| Actual 12B-1 Fee | -- |
| Actual Management Fee | 0.53% |
| Administration Fee | 1.73M% |
| Maximum Front Load | -- |
| Maximum Deferred Load | -- |
| Maximum Redemption Fee | -- |
| General Availability | |
| Available for Insurance Product |
|
| Available for RRSP | No |
| Purchase Details | |
| Open to New Investors |
|
| Minimum Initial Investment | 0.00 None |
| Minimum Subsequent Investment | 0.00 None |
Basic Info
| Investment Strategy | |
| The Fund seeks long-term capital appreciation. The fund will invest at least 80% of its assets, plus any borrowings made for investment in US equity securities which include publicly traded common stocks. Unaffiliated investment managers generally provide day-to-day management for a portion of the Funds assets. |
| General | |
| Security Type | Insurance Fund |
| Equity Style | Multi Cap Core |
| Broad Asset Class | US Equity |
| Broad Category | Equity |
| Global Peer Group | Equity US |
| Peer Group | Large-Cap Core Funds |
| Global Macro | Equity North America |
| US Macro | Large-Cap Funds |
| YCharts Categorization | -- |
| YCharts Benchmark | -- |
| Prospectus Objective | Growth & Income Funds |
| Fund Owner Firm Name | Jackson |
| Broad Asset Class Benchmark Index | |
| ^SPXTR | 100.0% |
Fundamentals
| General | |
| Distribution Yield | -- |
| Dividend Yield TTM (5-27-26) | 0.00% |
| 30-Day SEC Yield | -- |
| 7-Day SEC Yield | -- |
| Number of Holdings | 91 |
| Stock | |
| Weighted Average PE Ratio | 26.76 |
| Weighted Average Price to Sales Ratio | 4.419 |
| Weighted Average Price to Book Ratio | 7.535 |
| Weighted Median ROE | 34.36% |
| Weighted Median ROA | 11.82% |
| ROI (TTM) | 18.46% |
| Return on Investment (TTM) | 18.46% |
| Earning Yield | 0.0501 |
| LT Debt / Shareholders Equity | 0.7874 |
| Number of Equity Holdings | 87 |
As of March 31, 2026
Growth Metrics
| EPS Growth (1Y) | 31.41% |
| EPS Growth (3Y) | 19.71% |
| EPS Growth (5Y) | 22.05% |
| Sales Growth (1Y) | 15.00% |
| Sales Growth (3Y) | 9.64% |
| Sales Growth (5Y) | 10.59% |
| Sales per Share Growth (1Y) | 14.60% |
| Sales per Share Growth (3Y) | 9.51% |
| Operating Cash Flow - Growth Rate (3Y) | 32.33% |
As of March 31, 2026
Fund Details
| Key Dates | |
| Launch Date | 11/15/2022 |
| Last Annual Report Date | 12/31/2025 |
| Last Prospectus Date | 4/28/2025 |
| Share Classes | |
| LP40235618 | A |
| Attributes | |
| Index Fund | -- |
| Inverse Fund | No |
| Leveraged Fund | -- |
| Fund of Funds | No |
| Currency Hedged Fund | -- |
| Socially Responsible Fund | No |
Top Portfolio Holders
| Name | % Weight |
|---|---|
| Portfolio A | 5.00% |
| Portfolio B | 3.50% |
| Portfolio C | 2.25% |