

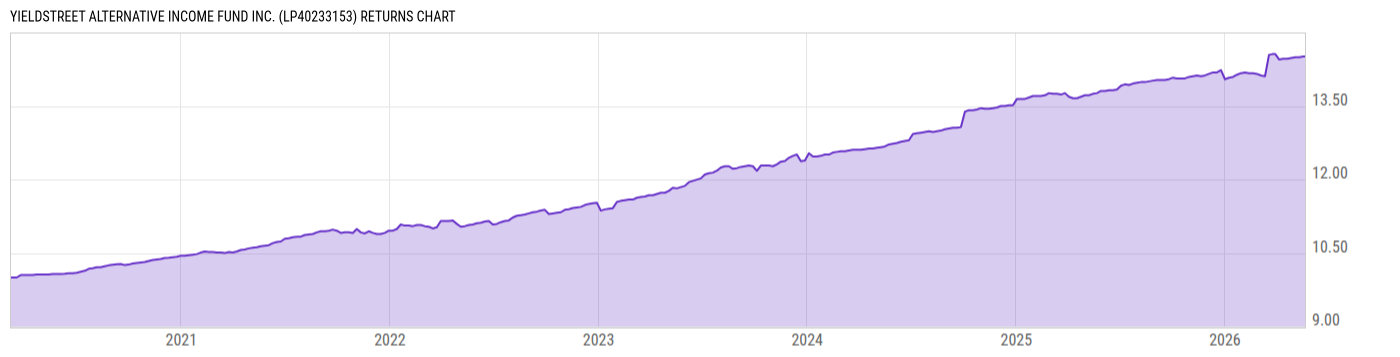
YieldStreet Alternative Income Fund Inc. (LP40233153)
9.18
0.00 (0.00%)
USD |
May 21 2026
Returns Chart
Key Stats
| Net Expense Ratio | Total Assets Under Management | Weighted Average Dividend Yield | Turnover Ratio (Generic) |
|---|---|---|---|
| 3.39% | 140.09M | -- | 48.00% |
| 1 Year Fund Level Flows | 1 Year Total Returns (Daily) | Annualized Total Returns Since Inception (Daily) | Max Drawdown (Since Inception) |
| -- | 5.44% |
Basic Info
| Investment Strategy | |
| The Fund seeks to generate current income and, as a secondary objective, capital appreciation. The Fund seeks to achieve their investment objective by primarily investing in Credit Investments. Such Credit Investments may include instruments directly or indirectly secured by real or personal property. |
| General | |
| Security Type | Unlisted Closed-End Fund |
| Equity Style | -- |
| Broad Asset Class | Taxable Bond |
| Broad Category | Fixed Income |
| Global Peer Group | Loan Participation Funds |
| Peer Group | Loan Participation Funds |
| Global Macro | Loan Participation Funds |
| US Macro | General Domestic Taxable Fixed Income Funds |
| YCharts Categorization | -- |
| YCharts Benchmark | -- |
| Prospectus Objective | Loan Participation Funds |
| Fund Owner Firm Name | YieldStreet Prism Fund |
| Broad Asset Class Benchmark Index | |
| ^BBUSATR | 100.0% |
Net Fund Flows Versus Peer Group
1 Month
% Rank:
--
-253.42M
Peer Group Low
759.64M
Peer Group High
1 Year
% Rank:
--
-2.001B
Peer Group Low
5.560B
Peer Group High
3 Months
% Rank:
--
-1.463B
Peer Group Low
1.631B
Peer Group High
3 Years
% Rank:
--
-2.784B
Peer Group Low
21.89B
Peer Group High
6 Months
% Rank:
--
-1.675B
Peer Group Low
3.793B
Peer Group High
5 Years
% Rank:
--
-4.082B
Peer Group Low
24.26B
Peer Group High
YTD
% Rank:
--
-1.576B
Peer Group Low
2.664B
Peer Group High
10 Years
% Rank:
--
-10.84B
Peer Group Low
24.98B
Peer Group High
Date Unavailable
Risk
Performance Versus Peer Group
Annual Total Returns Versus Peers
As of May 22, 2026.
Asset Allocation
As of December 31, 2025.
| Type | % Net |
|---|---|
| Cash | 2.88% |
| Stock | 23.68% |
| Bond | 66.59% |
| Convertible | 0.00% |
| Preferred | 14.05% |
| Other | -7.21% |
Top 10 Holdings
| Name | % Weight | Price | % Change |
|---|---|---|---|
|
YS AVN AVT V LLC PFD
|
7.43% | -- | -- |
| SEI Government Fund Institutional | 4.51% | 1.00 | 0.00% |
|
Coventry Life Insurance Portfolio FRN 28-Jun-2028
|
4.49% | -- | -- |
|
Octane Lending Inc Lll
|
4.37% | -- | -- |
|
9RPJ1 Partners LP PFD
|
3.89% | -- | -- |
|
Harrison Yards Project FRN 31-Dec-2026
|
3.83% | -- | -- |
|
New Mountain Capital
|
3.68% | -- | -- |
|
Sucden Clotidle FRN 31-May-2028
|
3.33% | -- | -- |
|
Octane Lending Inc II
|
3.31% | -- | -- |
|
ROCKFORD TOWER CLO 212R DR SEQ FLT 7.513% 20-JUL-2034
|
3.29% | -- | -- |
Fees & Availability
| Fees | |
| Actual 12B-1 Fee | -- |
| Actual Management Fee | 1.00% |
| Administration Fee | 585.1K% |
| Maximum Front Load | -- |
| Maximum Deferred Load | -- |
| Maximum Redemption Fee | -- |
| General Availability | |
| Available for Insurance Product | No |
| Available for RRSP | No |
| Purchase Details | |
| Open to New Investors |
|
| Minimum Initial Investment | 5000.00 None |
| Minimum Subsequent Investment | 0.00 None |
Basic Info
| Investment Strategy | |
| The Fund seeks to generate current income and, as a secondary objective, capital appreciation. The Fund seeks to achieve their investment objective by primarily investing in Credit Investments. Such Credit Investments may include instruments directly or indirectly secured by real or personal property. |
| General | |
| Security Type | Unlisted Closed-End Fund |
| Equity Style | -- |
| Broad Asset Class | Taxable Bond |
| Broad Category | Fixed Income |
| Global Peer Group | Loan Participation Funds |
| Peer Group | Loan Participation Funds |
| Global Macro | Loan Participation Funds |
| US Macro | General Domestic Taxable Fixed Income Funds |
| YCharts Categorization | -- |
| YCharts Benchmark | -- |
| Prospectus Objective | Loan Participation Funds |
| Fund Owner Firm Name | YieldStreet Prism Fund |
| Broad Asset Class Benchmark Index | |
| ^BBUSATR | 100.0% |
Fundamentals
| General | |
| Distribution Yield | -- |
| Dividend Yield TTM (5-21-26) | 6.54% |
| 30-Day SEC Yield | -- |
| 7-Day SEC Yield | -- |
| Number of Holdings | 60 |
| Stock | |
| Weighted Average PE Ratio | -- |
| Weighted Average Price to Sales Ratio | -- |
| Weighted Average Price to Book Ratio | -- |
| Weighted Median ROE | -- |
| Weighted Median ROA | -- |
| ROI (TTM) | -- |
| Return on Investment (TTM) | -- |
| Earning Yield | -- |
| LT Debt / Shareholders Equity | -- |
| Number of Equity Holdings | 13 |
| Bond | |
| Yield to Maturity (12-31-25) | 7.42% |
| Effective Duration | -- |
| Average Coupon | 8.87% |
| Calculated Average Quality | 4.223 |
| Effective Maturity | 6.723 |
| Nominal Maturity | 6.723 |
| Number of Bond Holdings | 40 |
As of December 31, 2025
Growth Metrics
| EPS Growth (1Y) | -- |
| EPS Growth (3Y) | -- |
| EPS Growth (5Y) | -- |
| Sales Growth (1Y) | -- |
| Sales Growth (3Y) | -- |
| Sales Growth (5Y) | -- |
| Sales per Share Growth (1Y) | -- |
| Sales per Share Growth (3Y) | -- |
| Operating Cash Flow - Growth Rate (3Y) | -- |
As of December 31, 2025
Fund Details
| Key Dates | |
| Launch Date | 3/9/2020 |
| Last Annual Report Date | 12/31/2025 |
| Last Prospectus Date | 4/29/2025 |
| Attributes | |
| Index Fund | -- |
| Inverse Fund | No |
| Leveraged Fund | -- |
| Fund of Funds | No |
| Currency Hedged Fund | -- |
| Socially Responsible Fund | No |
Top Portfolio Holders
| Name | % Weight |
|---|---|
| Portfolio A | 5.00% |
| Portfolio B | 3.50% |
| Portfolio C | 2.25% |