

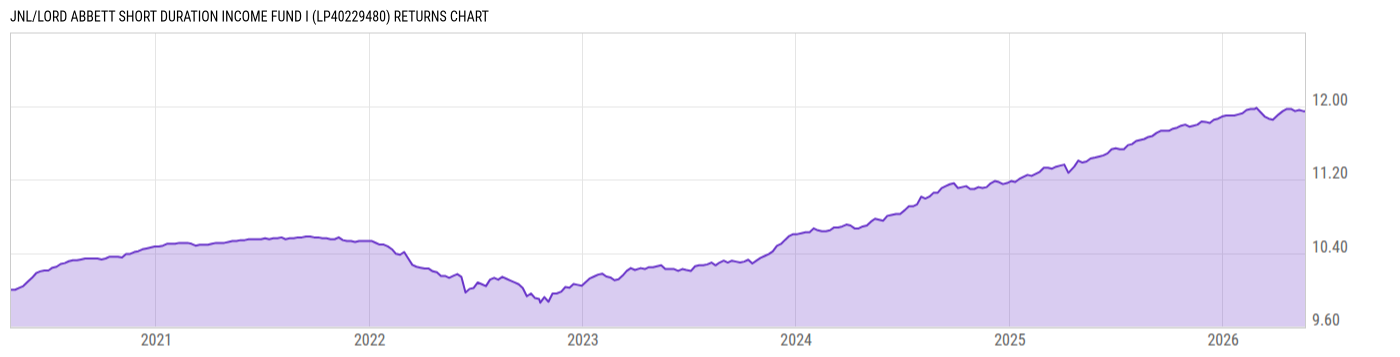
JNL/Lord Abbett Short Duration Income Fund I (LP40229480)
10.21
-0.02
(-0.20%)
USD |
Jun 05 2026
Returns Chart
Key Stats
| Net Expense Ratio | Total Assets Under Management | Weighted Average Dividend Yield | Turnover Ratio (Generic) |
|---|---|---|---|
| 0.50% | 633.11M | -- | 96.00% |
| 1 Year Fund Level Flows | 1 Year Total Returns (Daily) | Annualized Total Returns Since Inception (Daily) | Max Drawdown (Since Inception) |
| -36.46M | 4.31% |
Basic Info
| Investment Strategy | |
| The Fund seeks high level of income consistent with preservation of capital. The Fund invests primarily in various types of short-duration debt (or fixed-income) securities. The Fund seeks to achieve its investment objective by investing at least 65% of its net assets in investment-grade debt securities of various types. |
| General | |
| Security Type | Insurance Fund |
| Equity Style | -- |
| Broad Asset Class | Taxable Bond |
| Broad Category | Fixed Income |
| Global Peer Group | Bond USD Short Term |
| Peer Group | Short Investment Grade Debt Funds |
| Global Macro | Bond Short Term |
| US Macro | Short/Intermediate Investment-Grade Funds |
| YCharts Categorization | -- |
| YCharts Benchmark | -- |
| Prospectus Objective | Short Investment Grade Debt Funds |
| Fund Owner Firm Name | Jackson |
| Broad Asset Class Benchmark Index | |
| ^BBUSATR | 100.0% |
Net Fund Flows Versus Peer Group
1 Month
% Rank:
78
-45.67M
Peer Group Low
1.895B
Peer Group High
1 Year
% Rank:
76
-36.46M
-5.690B
Peer Group Low
8.661B
Peer Group High
3 Months
% Rank:
60
-2.968B
Peer Group Low
3.650B
Peer Group High
3 Years
% Rank:
83
-10.63B
Peer Group Low
8.661B
Peer Group High
6 Months
% Rank:
84
-4.269B
Peer Group Low
8.661B
Peer Group High
5 Years
% Rank:
59
-27.43B
Peer Group Low
9.200B
Peer Group High
YTD
% Rank:
82
-3.260B
Peer Group Low
8.660B
Peer Group High
10 Years
% Rank:
16
-11.15B
Peer Group Low
23.88B
Peer Group High
Date Unavailable
Risk
Performance Versus Peer Group
Annual Total Returns Versus Peers
As of June 09, 2026.
Asset Allocation
As of March 31, 2026.
| Type | % Net |
|---|---|
| Cash | 0.81% |
| Stock | 0.00% |
| Bond | 99.96% |
| Convertible | 0.00% |
| Preferred | 0.00% |
| Other | -0.78% |
Top 10 Holdings
| Name | % Weight | Price | % Change |
|---|---|---|---|
| United States of America USGB 3.5 12/15/2028 FIX USD Government | 1.49% | 98.43 | 0.09% |
|
WELLS FARGO COMMERCIAL MORTGAGE TRUST 17C40 A3 FIX 3.317% 17-OCT-2050
|
0.54% | -- | -- |
| Uber Technologies, Inc. UBERTEC 4.5 08/15/2029 FIX USD Corporate 144A | 0.53% | 99.18 | 0.15% |
|
APEX CREDIT CLO LTD 211R ANR FLT 5.10444% 18-JUL-2034
|
0.53% | -- | -- |
| BANK5 2025-5YR14 BANKYRAH 5.646 04/17/2058 FIX USD Corporate | 0.52% | 102.37 | 0.33% |
| The Goldman Sachs Group, Inc. GS 4.223 05/01/2029 FLT USD Corporate '28 | 0.51% | 99.10 | 0.10% |
|
USD Cash
|
0.50% | -- | -- |
| Eagle Funding LuxCo S.a r.l. EAGLEFU 5.5 08/17/2030 FIX USD Corporate 144A | 0.49% | 100.23 | 0.08% |
| Oracle Corporation ORCLE 4.45 09/26/2030 FIX USD Corporate | 0.46% | 96.43 | 0.09% |
| FOUNDRY JV HOLDCO LLC FOUNJV 5.9 01/25/2030 FIX USD Corporate 144A | 0.45% | 103.02 | 0.05% |
Fees & Availability
| Fees | |
| Actual 12B-1 Fee | -- |
| Actual Management Fee | 0.35% |
| Administration Fee | 339.2K% |
| Maximum Front Load | -- |
| Maximum Deferred Load | -- |
| Maximum Redemption Fee | -- |
| General Availability | |
| Available for Insurance Product |
|
| Available for RRSP | No |
| Purchase Details | |
| Open to New Investors |
|
| Minimum Initial Investment | 0.00 None |
| Minimum Subsequent Investment | 0.00 None |
Basic Info
| Investment Strategy | |
| The Fund seeks high level of income consistent with preservation of capital. The Fund invests primarily in various types of short-duration debt (or fixed-income) securities. The Fund seeks to achieve its investment objective by investing at least 65% of its net assets in investment-grade debt securities of various types. |
| General | |
| Security Type | Insurance Fund |
| Equity Style | -- |
| Broad Asset Class | Taxable Bond |
| Broad Category | Fixed Income |
| Global Peer Group | Bond USD Short Term |
| Peer Group | Short Investment Grade Debt Funds |
| Global Macro | Bond Short Term |
| US Macro | Short/Intermediate Investment-Grade Funds |
| YCharts Categorization | -- |
| YCharts Benchmark | -- |
| Prospectus Objective | Short Investment Grade Debt Funds |
| Fund Owner Firm Name | Jackson |
| Broad Asset Class Benchmark Index | |
| ^BBUSATR | 100.0% |
Fundamentals
| General | |
| Distribution Yield | -- |
| Dividend Yield TTM (6-5-26) | 4.87% |
| 30-Day SEC Yield (4-30-26) | 4.55% |
| 7-Day SEC Yield | -- |
| Number of Holdings | 791 |
| Bond | |
| Yield to Maturity (3-31-26) | 5.12% |
| Effective Duration | 1.95 |
| Average Coupon | 5.21% |
| Calculated Average Quality | 3.286 |
| Effective Maturity | 6.256 |
| Nominal Maturity | 6.404 |
| Number of Bond Holdings | 768 |
As of March 31, 2026
Fund Details
| Key Dates | |
| Launch Date | 4/27/2020 |
| Last Annual Report Date | 12/31/2025 |
| Last Prospectus Date | 4/28/2025 |
| Share Classes | |
| LP40229479 | A |
| Attributes | |
| Index Fund | -- |
| Inverse Fund | No |
| Leveraged Fund | -- |
| Fund of Funds | No |
| Currency Hedged Fund | -- |
| Socially Responsible Fund | No |
Top Portfolio Holders
| Name | % Weight |
|---|---|
| Portfolio A | 5.00% |
| Portfolio B | 3.50% |
| Portfolio C | 2.25% |