

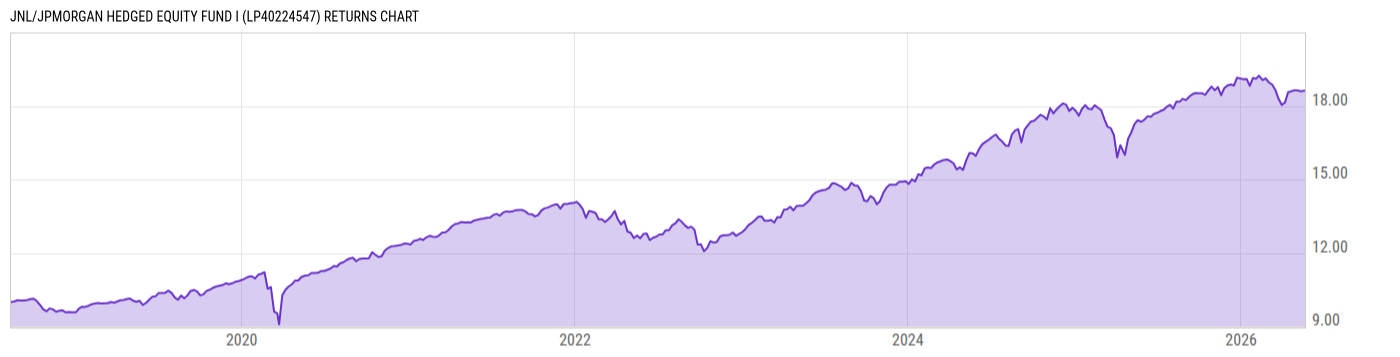
JNL/JPMorgan Hedged Equity Fund I (LP40224547)
17.89
0.00 (0.00%)
USD |
Jun 08 2026
Returns Chart
Key Stats
| Net Expense Ratio | Total Assets Under Management | Weighted Average Dividend Yield | Turnover Ratio (Generic) |
|---|---|---|---|
| 0.66% | 803.44M | -- | 30.00% |
| 1 Year Fund Level Flows | 1 Year Total Returns (Daily) | Annualized Total Returns Since Inception (Daily) | Max Drawdown (Since Inception) |
| -136.09M | 6.05% |
Basic Info
| Investment Strategy | |
| The Fund seeks to provide capital appreciation. The Fund will invest at least 80% of its assets in equity securities, and will also systematically purchase and sell exchange-traded put options and sell exchange-traded call options, employing an options overlay known as a "put/spread collar" strategy. |
| General | |
| Security Type | Insurance Fund |
| Equity Style | -- |
| Broad Asset Class | Alternative |
| Broad Category | Alternative Strategies |
| Global Peer Group | Alternative Other |
| Peer Group | Alternative Other Funds |
| Global Macro | Liquid Alternatives |
| US Macro | Alternative Equity Funds |
| YCharts Categorization | -- |
| YCharts Benchmark | -- |
| Prospectus Objective | Alternative Other Funds |
| Fund Owner Firm Name | Jackson |
| Broad Asset Class Benchmark Index | |
| ^MSACWINTR | 100.0% |
Net Fund Flows Versus Peer Group
1 Month
% Rank:
90
-82.81M
Peer Group Low
1.572M
Peer Group High
1 Year
% Rank:
90
-136.09M
-1.001B
Peer Group Low
5.690M
Peer Group High
3 Months
% Rank:
90
-292.82M
Peer Group Low
6.128M
Peer Group High
3 Years
% Rank:
81
-2.972B
Peer Group Low
110.92M
Peer Group High
6 Months
% Rank:
90
-548.27M
Peer Group Low
854706.0
Peer Group High
5 Years
% Rank:
28
-5.186B
Peer Group Low
110.92M
Peer Group High
YTD
% Rank:
93
-460.24M
Peer Group Low
826109.0
Peer Group High
10 Years
% Rank:
11
-9.038B
Peer Group Low
1.114B
Peer Group High
Date Unavailable
Risk
Performance Versus Peer Group
Annual Total Returns Versus Peers
As of June 10, 2026.
Asset Allocation
As of March 31, 2026.
| Type | % Net |
|---|---|
| Cash | 0.39% |
| Stock | 99.11% |
| Bond | 0.35% |
| Convertible | 0.00% |
| Preferred | 0.00% |
| Other | 0.15% |
Top 10 Holdings
| Name | % Weight | Price | % Change |
|---|---|---|---|
| NVIDIA Corp. | 8.10% | 208.19 | -0.22% |
| Apple, Inc. | 6.51% | 290.55 | -3.64% |
| Microsoft Corp. | 5.40% | 403.41 | -2.02% |
| Amazon.com, Inc. | 4.13% | 244.19 | -0.42% |
| Alphabet, Inc. | 3.05% | 364.26 | 0.26% |
| Broadcom Inc. | 2.80% | 392.16 | -1.12% |
| Meta Platforms, Inc. | 2.43% | 584.59 | -0.14% |
| Exxon Mobil Corp. | 2.18% | 148.91 | -1.87% |
| Alphabet, Inc. | 2.00% | 362.29 | 0.31% |
| Tesla, Inc. | 1.79% | 396.68 | -3.00% |
Fees & Availability
| Fees | |
| Actual 12B-1 Fee | -- |
| Actual Management Fee | 0.50% |
| Administration Fee | 52.21K% |
| Maximum Front Load | -- |
| Maximum Deferred Load | -- |
| Maximum Redemption Fee | -- |
| General Availability | |
| Available for Insurance Product |
|
| Available for RRSP | No |
| Purchase Details | |
| Open to New Investors |
|
| Minimum Initial Investment | 0.00 None |
| Minimum Subsequent Investment | 0.00 None |
Basic Info
| Investment Strategy | |
| The Fund seeks to provide capital appreciation. The Fund will invest at least 80% of its assets in equity securities, and will also systematically purchase and sell exchange-traded put options and sell exchange-traded call options, employing an options overlay known as a "put/spread collar" strategy. |
| General | |
| Security Type | Insurance Fund |
| Equity Style | -- |
| Broad Asset Class | Alternative |
| Broad Category | Alternative Strategies |
| Global Peer Group | Alternative Other |
| Peer Group | Alternative Other Funds |
| Global Macro | Liquid Alternatives |
| US Macro | Alternative Equity Funds |
| YCharts Categorization | -- |
| YCharts Benchmark | -- |
| Prospectus Objective | Alternative Other Funds |
| Fund Owner Firm Name | Jackson |
| Broad Asset Class Benchmark Index | |
| ^MSACWINTR | 100.0% |
Fundamentals
| General | |
| Distribution Yield | -- |
| Dividend Yield TTM (6-8-26) | 0.00% |
| 30-Day SEC Yield | -- |
| 7-Day SEC Yield | -- |
| Number of Holdings | 161 |
| Stock | |
| Weighted Average PE Ratio | 31.20 |
| Weighted Average Price to Sales Ratio | 7.916 |
| Weighted Average Price to Book Ratio | 10.75 |
| Weighted Median ROE | 158.5% |
| Weighted Median ROA | 18.29% |
| ROI (TTM) | 25.37% |
| Return on Investment (TTM) | 25.37% |
| Earning Yield | 0.0387 |
| LT Debt / Shareholders Equity | 0.6043 |
| Number of Equity Holdings | 155 |
As of March 31, 2026
Growth Metrics
| EPS Growth (1Y) | 25.73% |
| EPS Growth (3Y) | 20.70% |
| EPS Growth (5Y) | 26.28% |
| Sales Growth (1Y) | 15.74% |
| Sales Growth (3Y) | 15.99% |
| Sales Growth (5Y) | 16.50% |
| Sales per Share Growth (1Y) | 16.27% |
| Sales per Share Growth (3Y) | 16.71% |
| Operating Cash Flow - Growth Rate (3Y) | 28.14% |
As of March 31, 2026
Fund Details
| Key Dates | |
| Launch Date | 8/13/2018 |
| Last Annual Report Date | 12/31/2025 |
| Last Prospectus Date | 4/27/2026 |
| Share Classes | |
| LP40224546 | A |
| Attributes | |
| Index Fund | -- |
| Inverse Fund | No |
| Leveraged Fund | -- |
| Fund of Funds | No |
| Currency Hedged Fund |
|
| Socially Responsible Fund | No |
Top Portfolio Holders
| Name | % Weight |
|---|---|
| Portfolio A | 5.00% |
| Portfolio B | 3.50% |
| Portfolio C | 2.25% |