

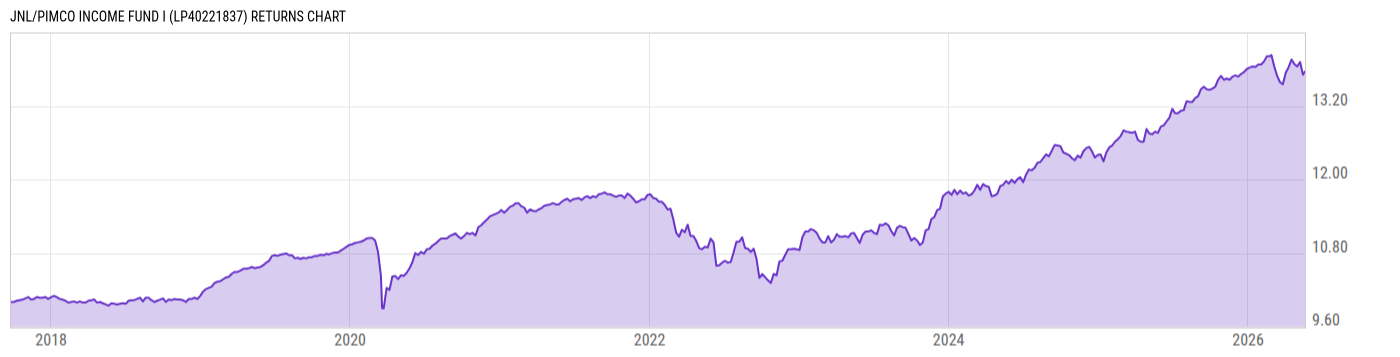
JNL/PIMCO Income Fund I (LP40221837)
13.39
-0.07
(-0.52%)
USD |
Jun 05 2026
Returns Chart
Key Stats
| Net Expense Ratio | Total Assets Under Management | Weighted Average Dividend Yield | Turnover Ratio (Generic) |
|---|---|---|---|
| 0.64% | 1.867B | -- | 19.00% |
| 1 Year Fund Level Flows | 1 Year Total Returns (Daily) | Annualized Total Returns Since Inception (Daily) | Max Drawdown (Since Inception) |
| 200.12M | 7.21% |
Basic Info
| Investment Strategy | |
| The Fund seeks maximum current income. Long-term capital appreciation is a secondary objective. It invests 65% of its total assets in a multi-sector portfolio of Fixed-Income Instruments of varying maturities, which may be represented by forwards or derivatives such as options, futures contracts or swap agreements. |
| General | |
| Security Type | Insurance Fund |
| Equity Style | -- |
| Broad Asset Class | Taxable Bond |
| Broad Category | Fixed Income |
| Global Peer Group | Bond Global USD |
| Peer Group | Global Income Funds |
| Global Macro | Bond Global |
| US Macro | World Income Funds |
| YCharts Categorization | -- |
| YCharts Benchmark | -- |
| Prospectus Objective | Global Income Funds |
| Fund Owner Firm Name | Jackson |
| Broad Asset Class Benchmark Index | |
| ^BBUSATR | 100.0% |
Net Fund Flows Versus Peer Group
1 Month
% Rank:
88
-35.14M
Peer Group Low
294.12M
Peer Group High
1 Year
% Rank:
17
200.12M
-1.119B
Peer Group Low
1.537B
Peer Group High
3 Months
% Rank:
76
-325.40M
Peer Group Low
571.67M
Peer Group High
3 Years
% Rank:
20
-2.484B
Peer Group Low
2.741B
Peer Group High
6 Months
% Rank:
14
-731.75M
Peer Group Low
783.93M
Peer Group High
5 Years
% Rank:
43
-7.808B
Peer Group Low
3.313B
Peer Group High
YTD
% Rank:
79
-469.47M
Peer Group Low
717.27M
Peer Group High
10 Years
% Rank:
11
-47.03B
Peer Group Low
4.548B
Peer Group High
Date Unavailable
Risk
Performance Versus Peer Group
Annual Total Returns Versus Peers
As of June 09, 2026.
Asset Allocation
As of March 31, 2026.
| Type | % Net |
|---|---|
| Cash | 2.75% |
| Stock | 0.44% |
| Bond | 97.58% |
| Convertible | 0.00% |
| Preferred | 0.05% |
| Other | -0.81% |
Top 10 Holdings
| Name | % Weight | Price | % Change |
|---|---|---|---|
|
Federal National Mortgage Association 6.5% 01-JUN-2056
|
11.02% | -- | -- |
|
Federal National Mortgage Association 5% 01-MAY-2056
|
10.23% | -- | -- |
|
Federal National Mortgage Association 6% 01-JUN-2056
|
5.76% | -- | -- |
| FEDERAL NATIONAL MORTGAGE ASSOCIATION FNMA-New 5.5 03/25/2036 FIX USD Agency | 4.59% | 99.97 | -0.38% |
|
Federal National Mortgage Association 6% 01-JUL-2055
|
4.10% | -- | -- |
|
Brazil, Federative Republic of (Government) 0% 01-JUL-2026
|
3.35% | -- | -- |
|
Federal National Mortgage Association 5.5% 01-MAY-2056
|
2.24% | -- | -- |
|
Government National Mortgage Association 2 6.5%
|
2.14% | -- | -- |
|
USD Cash
|
2.02% | -- | -- |
|
Federal Home Loan Mortgage Corp 01-FEB-2053 SD8301
|
1.96% | -- | -- |
Fees & Availability
| Fees | |
| Actual 12B-1 Fee | -- |
| Actual Management Fee | 0.48% |
| Administration Fee | 708.1K% |
| Maximum Front Load | -- |
| Maximum Deferred Load | -- |
| Maximum Redemption Fee | -- |
| General Availability | |
| Available for Insurance Product |
|
| Available for RRSP | No |
| Purchase Details | |
| Open to New Investors |
|
| Minimum Initial Investment | 0.00 None |
| Minimum Subsequent Investment | 0.00 None |
Basic Info
| Investment Strategy | |
| The Fund seeks maximum current income. Long-term capital appreciation is a secondary objective. It invests 65% of its total assets in a multi-sector portfolio of Fixed-Income Instruments of varying maturities, which may be represented by forwards or derivatives such as options, futures contracts or swap agreements. |
| General | |
| Security Type | Insurance Fund |
| Equity Style | -- |
| Broad Asset Class | Taxable Bond |
| Broad Category | Fixed Income |
| Global Peer Group | Bond Global USD |
| Peer Group | Global Income Funds |
| Global Macro | Bond Global |
| US Macro | World Income Funds |
| YCharts Categorization | -- |
| YCharts Benchmark | -- |
| Prospectus Objective | Global Income Funds |
| Fund Owner Firm Name | Jackson |
| Broad Asset Class Benchmark Index | |
| ^BBUSATR | 100.0% |
Fundamentals
| General | |
| Distribution Yield | -- |
| Dividend Yield TTM (6-5-26) | 0.00% |
| 30-Day SEC Yield (4-30-26) | 4.87% |
| 7-Day SEC Yield | -- |
| Number of Holdings | 740 |
| Bond | |
| Yield to Maturity (3-31-26) | 5.17% |
| Effective Duration | 6.57 |
| Average Coupon | 6.20% |
| Calculated Average Quality | 2.414 |
| Effective Maturity | 17.60 |
| Nominal Maturity | 17.65 |
| Number of Bond Holdings | 581 |
As of March 31, 2026
Fund Details
| Key Dates | |
| Launch Date | 9/25/2017 |
| Last Annual Report Date | 12/31/2025 |
| Last Prospectus Date | 4/28/2025 |
| Share Classes | |
| LP40221881 | A |
| Attributes | |
| Index Fund | -- |
| Inverse Fund | No |
| Leveraged Fund | -- |
| Fund of Funds | No |
| Currency Hedged Fund | -- |
| Socially Responsible Fund | No |
Top Portfolio Holders
| Name | % Weight |
|---|---|
| Portfolio A | 5.00% |
| Portfolio B | 3.50% |
| Portfolio C | 2.25% |