

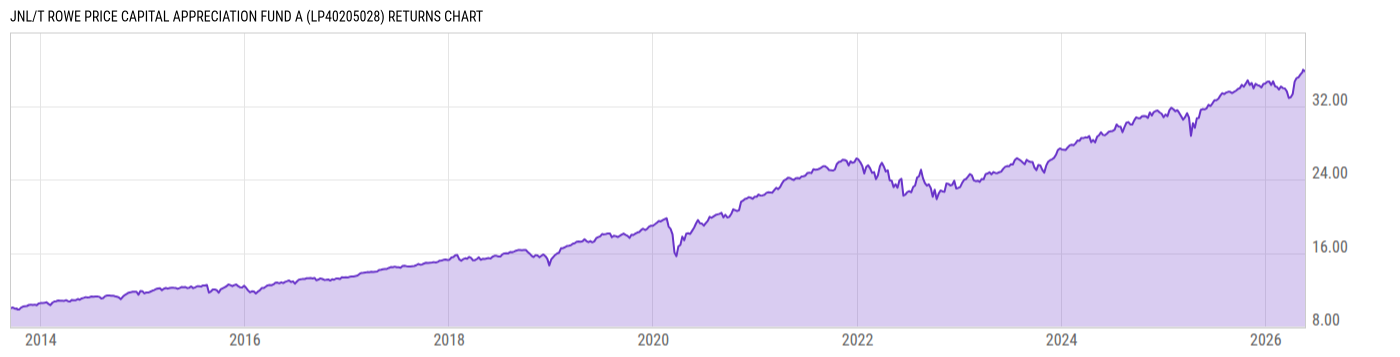
JNL/T Rowe Price Capital Appreciation Fund A (LP40205028)
32.06
-0.04
(-0.12%)
USD |
Jun 08 2026
Returns Chart
Key Stats
| Net Expense Ratio | Total Assets Under Management | Weighted Average Dividend Yield | Turnover Ratio (Generic) |
|---|---|---|---|
| 0.95% | 15.16B | 0.86% | 124.0% |
| 1 Year Fund Level Flows | 1 Year Total Returns (Daily) | Annualized Total Returns Since Inception (Daily) | Max Drawdown (Since Inception) |
| -1.285B | 10.55% |
Basic Info
| Investment Strategy | |
| The Fund seeks long-term capital appreciation by investing at least 50% of its total assets in common stocks while the remainder are generally held in fixed income and other securities to help preserve principal value. The Fund has significant flexibility to invest in a broad range of equity and fixed income securities. |
| General | |
| Security Type | Insurance Fund |
| Equity Style | Multi Cap Core |
| Broad Asset Class | Allocation |
| Broad Category | Allocation |
| Global Peer Group | Mixed Asset USD Flexible - US |
| Peer Group | Flexible Portfolio Funds |
| Global Macro | Mixed Asset HC Flexible |
| US Macro | Mixed-Assets Funds |
| YCharts Categorization | -- |
| YCharts Benchmark | -- |
| Prospectus Objective | Flexible Portfolio Funds |
| Fund Owner Firm Name | Jackson |
| Broad Asset Class Benchmark Index | |
| ^SPXTR | 100.0% |
Net Fund Flows Versus Peer Group
1 Month
% Rank:
98
-283.22M
Peer Group Low
1.386B
Peer Group High
1 Year
% Rank:
98
-1.285B
-3.136B
Peer Group Low
12.22B
Peer Group High
3 Months
% Rank:
98
-727.84M
Peer Group Low
12.22B
Peer Group High
3 Years
% Rank:
95
-12.10B
Peer Group Low
12.22B
Peer Group High
6 Months
% Rank:
98
-1.420B
Peer Group Low
12.22B
Peer Group High
5 Years
% Rank:
90
-14.65B
Peer Group Low
12.22B
Peer Group High
YTD
% Rank:
98
-1.211B
Peer Group Low
12.22B
Peer Group High
10 Years
% Rank:
2
-47.19B
Peer Group Low
12.34B
Peer Group High
Date Unavailable
Risk
Performance Versus Peer Group
Annual Total Returns Versus Peers
As of June 10, 2026.
Asset Allocation
As of March 31, 2026.
| Type | % Net |
|---|---|
| Cash | 0.15% |
| Stock | 61.78% |
| Bond | 35.95% |
| Convertible | 0.00% |
| Preferred | 0.00% |
| Other | 2.12% |
Top 10 Holdings
| Name | % Weight | Price | % Change |
|---|---|---|---|
| Amazon.com, Inc. | 4.98% | 237.99 | -2.54% |
| Microsoft Corp. | 4.44% | 397.35 | -1.50% |
| Meta Platforms, Inc. | 3.87% | 570.96 | -2.33% |
| Apple, Inc. | 3.79% | 291.63 | 0.37% |
| United States of America USGB 3.625 10/31/2030 FIX USD Government | 3.35% | 97.53 | 0.16% |
| NVIDIA Corp. | 3.25% | 200.44 | -3.72% |
| United States of America USGB 3.5 11/30/2030 FIX USD Government | 2.81% | 96.98 | 0.15% |
| United States of America USGB 3.5 02/28/2031 FIX USD Government | 2.69% | 96.82 | 0.15% |
| CenterPoint Energy, Inc. | 2.49% | 42.72 | 0.79% |
| Alphabet, Inc. | 2.44% | 356.50 | -2.13% |
Fees & Availability
| Fees | |
| Actual 12B-1 Fee | 0.30% |
| Actual Management Fee | 0.51% |
| Administration Fee | 18.86M% |
| Maximum Front Load | -- |
| Maximum Deferred Load | -- |
| Maximum Redemption Fee | -- |
| General Availability | |
| Available for Insurance Product |
|
| Available for RRSP | No |
| Purchase Details | |
| Open to New Investors |
|
| Minimum Initial Investment | 0.00 None |
| Minimum Subsequent Investment | 0.00 None |
Basic Info
| Investment Strategy | |
| The Fund seeks long-term capital appreciation by investing at least 50% of its total assets in common stocks while the remainder are generally held in fixed income and other securities to help preserve principal value. The Fund has significant flexibility to invest in a broad range of equity and fixed income securities. |
| General | |
| Security Type | Insurance Fund |
| Equity Style | Multi Cap Core |
| Broad Asset Class | Allocation |
| Broad Category | Allocation |
| Global Peer Group | Mixed Asset USD Flexible - US |
| Peer Group | Flexible Portfolio Funds |
| Global Macro | Mixed Asset HC Flexible |
| US Macro | Mixed-Assets Funds |
| YCharts Categorization | -- |
| YCharts Benchmark | -- |
| Prospectus Objective | Flexible Portfolio Funds |
| Fund Owner Firm Name | Jackson |
| Broad Asset Class Benchmark Index | |
| ^SPXTR | 100.0% |
Fundamentals
| General | |
| Distribution Yield | -- |
| Dividend Yield TTM (6-8-26) | 0.00% |
| 30-Day SEC Yield | -- |
| 7-Day SEC Yield | -- |
| Number of Holdings | 210 |
| Stock | |
| Weighted Average PE Ratio | 31.80 |
| Weighted Average Price to Sales Ratio | 8.462 |
| Weighted Average Price to Book Ratio | 9.435 |
| Weighted Median ROE | 39.49% |
| Weighted Median ROA | 13.12% |
| ROI (TTM) | 17.00% |
| Return on Investment (TTM) | 17.00% |
| Earning Yield | 0.0358 |
| LT Debt / Shareholders Equity | 0.6893 |
| Number of Equity Holdings | 59 |
| Bond | |
| Yield to Maturity (3-31-26) | 4.67% |
| Effective Duration | 3.04 |
| Average Coupon | 4.32% |
| Calculated Average Quality | 3.486 |
| Effective Maturity | 5.862 |
| Nominal Maturity | 5.979 |
| Number of Bond Holdings | 103 |
As of March 31, 2026
Growth Metrics
| EPS Growth (1Y) | 25.81% |
| EPS Growth (3Y) | 19.91% |
| EPS Growth (5Y) | 24.41% |
| Sales Growth (1Y) | 20.05% |
| Sales Growth (3Y) | 15.76% |
| Sales Growth (5Y) | 17.78% |
| Sales per Share Growth (1Y) | 22.61% |
| Sales per Share Growth (3Y) | 16.40% |
| Operating Cash Flow - Growth Rate (3Y) | 25.87% |
As of March 31, 2026
Fund Details
| Key Dates | |
| Launch Date | 9/16/2013 |
| Last Annual Report Date | 12/31/2025 |
| Last Prospectus Date | 4/27/2026 |
| Share Classes | |
| LP40221942 | Inst |
| Attributes | |
| Index Fund | -- |
| Inverse Fund | No |
| Leveraged Fund | -- |
| Fund of Funds | No |
| Currency Hedged Fund | -- |
| Socially Responsible Fund | No |
Top Portfolio Holders
| Name | % Weight |
|---|---|
| Portfolio A | 5.00% |
| Portfolio B | 3.50% |
| Portfolio C | 2.25% |