

JNL/Doubleline Total Return Fund A (LP40205027)
11.57
0.00 (0.00%)
USD |
Jun 08 2026
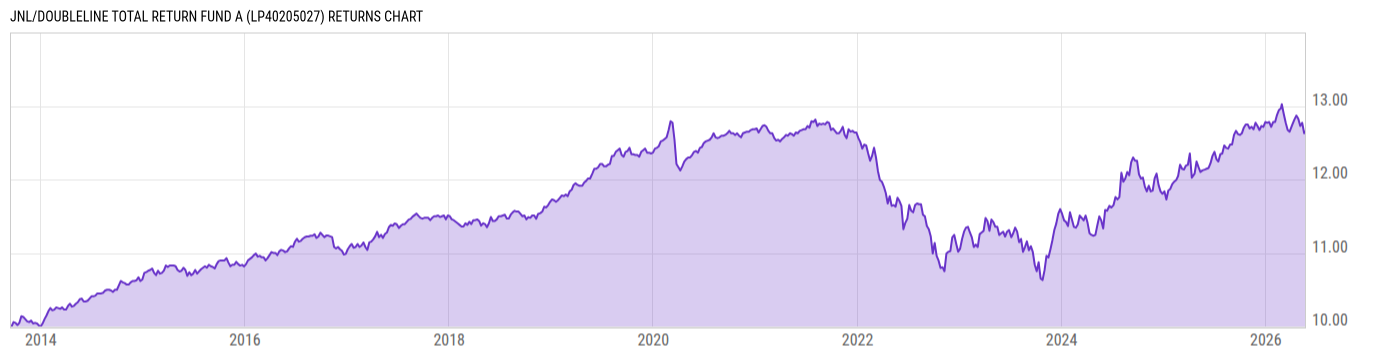
Returns Chart
Key Stats
| Net Expense Ratio | Total Assets Under Management | Weighted Average Dividend Yield | Turnover Ratio (Generic) |
|---|---|---|---|
| 0.83% | 1.655B | -- | 29.00% |
| 1 Year Fund Level Flows | 1 Year Total Returns (Daily) | Annualized Total Returns Since Inception (Daily) | Max Drawdown (Since Inception) |
| -247.09M | 4.80% |
Basic Info
| Investment Strategy | |
| The Fund seeks to maximize total return. The Fund invests at least 80% of its assets in bonds. The Fund intends to invest more than 50% of its net assets in mortgage-backed securities of any maturity or type. The Fund may invest in bonds of any credit quality, including those that are at the time of investment unrated. |
| General | |
| Security Type | Insurance Fund |
| Equity Style | -- |
| Broad Asset Class | Taxable Bond |
| Broad Category | Fixed Income |
| Global Peer Group | Bond USD Mortgages |
| Peer Group | U.S. Mortgage Funds |
| Global Macro | Bond HC |
| US Macro | U.S. Government & Treasury Fixed Income Funds |
| YCharts Categorization | -- |
| YCharts Benchmark | -- |
| Prospectus Objective | U.S. Mortgage Funds |
| Fund Owner Firm Name | Jackson |
| Broad Asset Class Benchmark Index | |
| ^BBUSATR | 100.0% |
Net Fund Flows Versus Peer Group
1 Month
% Rank:
97
-105.93M
Peer Group Low
315.90M
Peer Group High
1 Year
% Rank:
95
-247.09M
-2.129B
Peer Group Low
1.463B
Peer Group High
3 Months
% Rank:
96
-583.12M
Peer Group Low
530.19M
Peer Group High
3 Years
% Rank:
96
-6.769B
Peer Group Low
7.386B
Peer Group High
6 Months
% Rank:
96
-1.037B
Peer Group Low
1.036B
Peer Group High
5 Years
% Rank:
95
-18.17B
Peer Group Low
10.59B
Peer Group High
YTD
% Rank:
96
-615.00M
Peer Group Low
724.64M
Peer Group High
10 Years
% Rank:
93
-35.90B
Peer Group Low
25.97B
Peer Group High
Date Unavailable
Risk
Performance Versus Peer Group
Annual Total Returns Versus Peers
As of June 10, 2026.
Asset Allocation
As of March 31, 2026.
| Type | % Net |
|---|---|
| Cash | 0.74% |
| Stock | 0.00% |
| Bond | 99.33% |
| Convertible | 0.00% |
| Preferred | 0.00% |
| Other | -0.07% |
Top 10 Holdings
| Name | % Weight | Price | % Change |
|---|---|---|---|
|
Federal National Mortgage Association 01-APR-2032 BS4951
|
3.27% | -- | -- |
|
FEDERAL NATIONAL MORTGAGE ASSOCIATION 265C BD SEQ FIX 4.5% 25-APR-2053
|
1.93% | -- | -- |
|
Federal Home Loan Mortgage Corp 01-MAR-2052 SD7553
|
1.38% | -- | -- |
|
Government National Mortgage Association 2 20-AUG-2051 785639
|
1.37% | -- | -- |
|
Federal Home Loan Mortgage Corp 01-MAR-2054 SD5014
|
1.28% | -- | -- |
|
Federal National Mortgage Association 01-SEP-2050 FM4245
|
1.26% | -- | -- |
| FHLMC-New FIX USD Agency | 1.23% | 89.80 | 0.08% |
|
Federal National Mortgage Association 01-SEP-2053 FA0911
|
1.19% | -- | -- |
| FHLMC-New 3.0 09/15/2046 FIX USD Agency | 1.08% | 87.76 | 0.13% |
|
Federal National Mortgage Association 01-NOV-2053 FS7252
|
1.01% | -- | -- |
Fees & Availability
| Fees | |
| Actual 12B-1 Fee | 0.30% |
| Actual Management Fee | 0.43% |
| Administration Fee | 709.8K% |
| Maximum Front Load | -- |
| Maximum Deferred Load | -- |
| Maximum Redemption Fee | -- |
| General Availability | |
| Available for Insurance Product |
|
| Available for RRSP | No |
| Purchase Details | |
| Open to New Investors |
|
| Minimum Initial Investment | 0.00 None |
| Minimum Subsequent Investment | 0.00 None |
Basic Info
| Investment Strategy | |
| The Fund seeks to maximize total return. The Fund invests at least 80% of its assets in bonds. The Fund intends to invest more than 50% of its net assets in mortgage-backed securities of any maturity or type. The Fund may invest in bonds of any credit quality, including those that are at the time of investment unrated. |
| General | |
| Security Type | Insurance Fund |
| Equity Style | -- |
| Broad Asset Class | Taxable Bond |
| Broad Category | Fixed Income |
| Global Peer Group | Bond USD Mortgages |
| Peer Group | U.S. Mortgage Funds |
| Global Macro | Bond HC |
| US Macro | U.S. Government & Treasury Fixed Income Funds |
| YCharts Categorization | -- |
| YCharts Benchmark | -- |
| Prospectus Objective | U.S. Mortgage Funds |
| Fund Owner Firm Name | Jackson |
| Broad Asset Class Benchmark Index | |
| ^BBUSATR | 100.0% |
Fundamentals
| General | |
| Distribution Yield | -- |
| Dividend Yield TTM (6-8-26) | 0.00% |
| 30-Day SEC Yield (5-31-26) | 3.83% |
| 7-Day SEC Yield | -- |
| Number of Holdings | 507 |
| Bond | |
| Yield to Maturity (3-31-26) | 5.03% |
| Effective Duration | 5.95 |
| Average Coupon | 3.98% |
| Calculated Average Quality | 2.377 |
| Effective Maturity | 21.51 |
| Nominal Maturity | 21.51 |
| Number of Bond Holdings | 463 |
As of March 31, 2026
Fund Details
| Key Dates | |
| Launch Date | 9/16/2013 |
| Last Annual Report Date | 12/31/2025 |
| Last Prospectus Date | 4/27/2026 |
| Share Classes | |
| LP40221933 | Inst |
| Attributes | |
| Index Fund | -- |
| Inverse Fund | No |
| Leveraged Fund | -- |
| Fund of Funds | No |
| Currency Hedged Fund | -- |
| Socially Responsible Fund | No |
Top Portfolio Holders
| Name | % Weight |
|---|---|
| Portfolio A | 5.00% |
| Portfolio B | 3.50% |
| Portfolio C | 2.25% |