

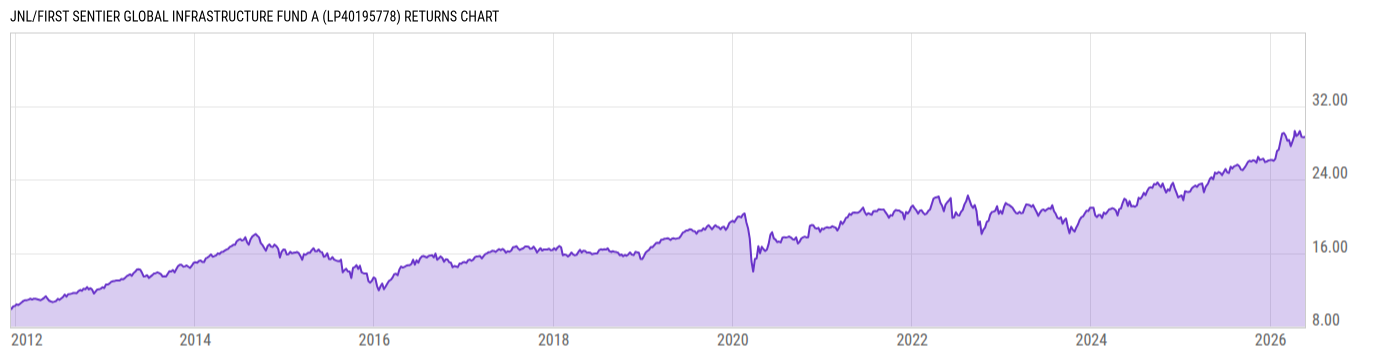
JNL/First Sentier Global Infrastructure Fund A (LP40195778)
23.02
-0.26
(-1.12%)
USD |
Jun 08 2026
Returns Chart
Key Stats
| Net Expense Ratio | Total Assets Under Management | Weighted Average Dividend Yield | Turnover Ratio (Generic) |
|---|---|---|---|
| 1.16% | 457.12M | 2.88% | 59.00% |
| 1 Year Fund Level Flows | 1 Year Total Returns (Daily) | Annualized Total Returns Since Inception (Daily) | Max Drawdown (Since Inception) |
| -119.32M | 13.12% |
Basic Info
| Investment Strategy | |
| The Fund seeks total return through growth of capital and current income. The Fund invest primarily in securities of publicly traded infrastructure companies throughtout the world, including United States. |
| General | |
| Security Type | Insurance Fund |
| Equity Style | Multi Cap Value |
| Broad Asset Class | Sector Equity |
| Broad Category | Equity |
| Global Peer Group | Equity Theme - Infrastructure |
| Peer Group | Global Infrastructure Funds |
| Global Macro | Equity Theme |
| US Macro | World Sector Equity Funds |
| YCharts Categorization | -- |
| YCharts Benchmark | -- |
| Prospectus Objective | Global Infrastructure Funds |
| Fund Owner Firm Name | Jackson |
| Broad Asset Class Benchmark Index | |
| ^MSWNTR | 100.0% |
Net Fund Flows Versus Peer Group
1 Month
% Rank:
93
-20.30M
Peer Group Low
1.141B
Peer Group High
1 Year
% Rank:
94
-119.32M
-139.90M
Peer Group Low
6.706B
Peer Group High
3 Months
% Rank:
93
-39.17M
Peer Group Low
2.281B
Peer Group High
3 Years
% Rank:
89
-720.62M
Peer Group Low
7.952B
Peer Group High
6 Months
% Rank:
93
-219.53M
Peer Group Low
4.639B
Peer Group High
5 Years
% Rank:
92
-917.85M
Peer Group Low
8.300B
Peer Group High
YTD
% Rank:
93
-112.57M
Peer Group Low
4.298B
Peer Group High
10 Years
% Rank:
88
-3.831B
Peer Group Low
8.615B
Peer Group High
Date Unavailable
Risk
Performance Versus Peer Group
Annual Total Returns Versus Peers
As of June 10, 2026.
Asset Allocation
As of March 31, 2026.
| Type | % Net |
|---|---|
| Cash | 0.50% |
| Stock | 99.24% |
| Bond | 0.35% |
| Convertible | 0.00% |
| Preferred | 0.00% |
| Other | -0.09% |
Top 10 Holdings
| Name | % Weight | Price | % Change |
|---|---|---|---|
| Duke Energy Corp. | 5.25% | 125.04 | 0.98% |
| American Electric Power Co., Inc. | 4.63% | 128.48 | 0.56% |
| Union Pacific Corp. | 4.47% | 267.05 | -1.56% |
| ONEOK, Inc. | 4.13% | 90.57 | 3.17% |
| NextEra Energy, Inc. | 3.98% | 85.10 | 0.31% |
| Transurban Group Ltd. | 3.97% | 10.00 | 0.00% |
| CSX Corp. | 3.88% | 46.40 | -1.87% |
| Sempra | 3.56% | 91.08 | 0.23% |
| National Grid Plc | 3.47% | 16.25 | 3.97% |
| SBA Communications Corp. | 3.38% | 207.26 | 1.21% |
Fees & Availability
| Fees | |
| Actual 12B-1 Fee | 0.30% |
| Actual Management Fee | 0.70% |
| Administration Fee | 745.9K% |
| Maximum Front Load | -- |
| Maximum Deferred Load | -- |
| Maximum Redemption Fee | -- |
| General Availability | |
| Available for Insurance Product |
|
| Available for RRSP | No |
| Purchase Details | |
| Open to New Investors |
|
| Minimum Initial Investment | 0.00 None |
| Minimum Subsequent Investment | 0.00 None |
Basic Info
| Investment Strategy | |
| The Fund seeks total return through growth of capital and current income. The Fund invest primarily in securities of publicly traded infrastructure companies throughtout the world, including United States. |
| General | |
| Security Type | Insurance Fund |
| Equity Style | Multi Cap Value |
| Broad Asset Class | Sector Equity |
| Broad Category | Equity |
| Global Peer Group | Equity Theme - Infrastructure |
| Peer Group | Global Infrastructure Funds |
| Global Macro | Equity Theme |
| US Macro | World Sector Equity Funds |
| YCharts Categorization | -- |
| YCharts Benchmark | -- |
| Prospectus Objective | Global Infrastructure Funds |
| Fund Owner Firm Name | Jackson |
| Broad Asset Class Benchmark Index | |
| ^MSWNTR | 100.0% |
Fundamentals
| General | |
| Distribution Yield | -- |
| Dividend Yield TTM (6-8-26) | 0.00% |
| 30-Day SEC Yield | -- |
| 7-Day SEC Yield | -- |
| Number of Holdings | 56 |
| Stock | |
| Weighted Average PE Ratio | 23.99 |
| Weighted Average Price to Sales Ratio | 4.396 |
| Weighted Average Price to Book Ratio | 3.841 |
| Weighted Median ROE | 16.29% |
| Weighted Median ROA | 5.26% |
| ROI (TTM) | 5.98% |
| Return on Investment (TTM) | 5.98% |
| Earning Yield | 0.0491 |
| LT Debt / Shareholders Equity | 1.406 |
| Number of Equity Holdings | 42 |
As of March 31, 2026
Growth Metrics
| EPS Growth (1Y) | 19.16% |
| EPS Growth (3Y) | 15.95% |
| EPS Growth (5Y) | 15.53% |
| Sales Growth (1Y) | 7.97% |
| Sales Growth (3Y) | 3.91% |
| Sales Growth (5Y) | 9.15% |
| Sales per Share Growth (1Y) | 6.68% |
| Sales per Share Growth (3Y) | 3.30% |
| Operating Cash Flow - Growth Rate (3Y) | 12.50% |
As of March 31, 2026
Fund Details
| Key Dates | |
| Launch Date | 12/12/2011 |
| Last Annual Report Date | 12/31/2025 |
| Last Prospectus Date | 4/27/2026 |
| Share Classes | |
| LP40195779 | Inst |
| Attributes | |
| Index Fund | -- |
| Inverse Fund | No |
| Leveraged Fund | -- |
| Fund of Funds | No |
| Currency Hedged Fund | -- |
| Socially Responsible Fund | No |
Top Portfolio Holders
| Name | % Weight |
|---|---|
| Portfolio A | 5.00% |
| Portfolio B | 3.50% |
| Portfolio C | 2.25% |