

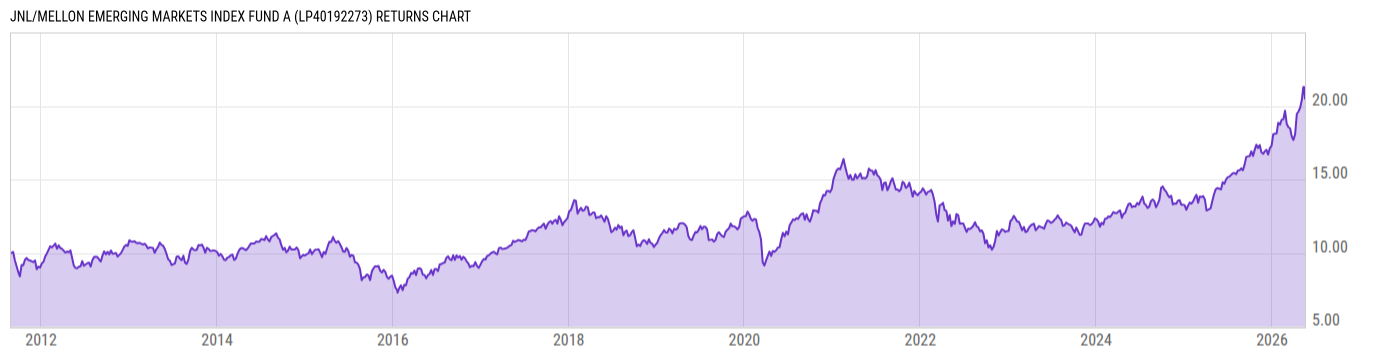
JNL/Mellon Emerging Markets Index Fund A (LP40192273)
18.07
-0.02
(-0.11%)
USD |
Jun 08 2026
Returns Chart
Key Stats
| Net Expense Ratio | Total Assets Under Management | Weighted Average Dividend Yield | Turnover Ratio (Generic) |
|---|---|---|---|
| 0.75% | 1.271B | -- | 11.00% |
| 1 Year Fund Level Flows | 1 Year Total Returns (Daily) | Annualized Total Returns Since Inception (Daily) | Max Drawdown (Since Inception) |
| 134.59M | 40.84% |
Basic Info
| Investment Strategy | |
| The Fund seeks to track the performance of a benchmark index that measures the investment return of stocks issued by companies located in emerging market countries. The Fund invest at least 80% of its assets in stock included in the MSCI Emerging Market Index, including depositary receipts representing of the Index. |
| General | |
| Security Type | Insurance Fund |
| Equity Style | -- |
| Broad Asset Class | International Equity |
| Broad Category | Equity |
| Global Peer Group | Equity Emerging Markets Global |
| Peer Group | Emerging Markets Funds |
| Global Macro | Equity Emerging Markets |
| US Macro | Emerging Markets Equity Funds |
| YCharts Categorization | -- |
| YCharts Benchmark | -- |
| Prospectus Objective | Emerging Markets Funds |
| Fund Owner Firm Name | Jackson |
| Broad Asset Class Benchmark Index | |
| ^MSACXUSNTR | 100.0% |
Net Fund Flows Versus Peer Group
1 Month
% Rank:
4
-1.331B
Peer Group Low
1.670B
Peer Group High
1 Year
% Rank:
18
134.59M
-8.933B
Peer Group Low
23.49B
Peer Group High
3 Months
% Rank:
11
-2.275B
Peer Group Low
3.500B
Peer Group High
3 Years
% Rank:
53
-20.46B
Peer Group Low
24.84B
Peer Group High
6 Months
% Rank:
14
-2.671B
Peer Group Low
11.45B
Peer Group High
5 Years
% Rank:
61
-33.39B
Peer Group Low
31.60B
Peer Group High
YTD
% Rank:
11
-1.969B
Peer Group Low
11.15B
Peer Group High
10 Years
% Rank:
74
-33.46B
Peer Group Low
77.97B
Peer Group High
Date Unavailable
Risk
Performance Versus Peer Group
Annual Total Returns Versus Peers
As of June 10, 2026.
Asset Allocation
As of March 31, 2026.
| Type | % Net |
|---|---|
| Cash | 0.62% |
| Stock | 97.43% |
| Bond | 0.56% |
| Convertible | 0.00% |
| Preferred | 1.84% |
| Other | -0.45% |
Top 4 Holdings
| Name | % Weight | Price | % Change |
|---|---|---|---|
| JNL Emerging Markets Index Fund I | 100.0% | 13.76 | -0.15% |
|
BRL Cash
|
0.00% | -- | -- |
|
USD Cash
|
0.00% | -- | -- |
|
Other Assets less Liabilities
|
-0.02% | -- | -- |
Fees & Availability
| Fees | |
| Actual 12B-1 Fee | 0.30% |
| Actual Management Fee | 0.28% |
| Administration Fee | 1.22M% |
| Maximum Front Load | -- |
| Maximum Deferred Load | -- |
| Maximum Redemption Fee | -- |
| General Availability | |
| Available for Insurance Product |
|
| Available for RRSP | No |
| Purchase Details | |
| Open to New Investors |
|
| Minimum Initial Investment | 0.00 None |
| Minimum Subsequent Investment | 0.00 None |
Basic Info
| Investment Strategy | |
| The Fund seeks to track the performance of a benchmark index that measures the investment return of stocks issued by companies located in emerging market countries. The Fund invest at least 80% of its assets in stock included in the MSCI Emerging Market Index, including depositary receipts representing of the Index. |
| General | |
| Security Type | Insurance Fund |
| Equity Style | -- |
| Broad Asset Class | International Equity |
| Broad Category | Equity |
| Global Peer Group | Equity Emerging Markets Global |
| Peer Group | Emerging Markets Funds |
| Global Macro | Equity Emerging Markets |
| US Macro | Emerging Markets Equity Funds |
| YCharts Categorization | -- |
| YCharts Benchmark | -- |
| Prospectus Objective | Emerging Markets Funds |
| Fund Owner Firm Name | Jackson |
| Broad Asset Class Benchmark Index | |
| ^MSACXUSNTR | 100.0% |
Fundamentals
| General | |
| Distribution Yield | -- |
| Dividend Yield TTM (6-8-26) | 0.00% |
| 30-Day SEC Yield | -- |
| 7-Day SEC Yield | -- |
| Number of Holdings | 4 |
| Stock | |
| Weighted Average PE Ratio | 23.38 |
| Weighted Average Price to Sales Ratio | 5.710 |
| Weighted Average Price to Book Ratio | 4.496 |
| Weighted Median ROE | 18.77% |
| Weighted Median ROA | 9.39% |
| ROI (TTM) | 15.15% |
| Return on Investment (TTM) | 15.15% |
| Earning Yield | 0.0618 |
| LT Debt / Shareholders Equity | 0.4028 |
| Number of Equity Holdings | 0 |
As of March 31, 2026
Growth Metrics
| EPS Growth (1Y) | 33.34% |
| EPS Growth (3Y) | 14.74% |
| EPS Growth (5Y) | 19.52% |
| Sales Growth (1Y) | 16.82% |
| Sales Growth (3Y) | 13.26% |
| Sales Growth (5Y) | 14.75% |
| Sales per Share Growth (1Y) | 18.87% |
| Sales per Share Growth (3Y) | 12.73% |
| Operating Cash Flow - Growth Rate (3Y) | 19.06% |
As of March 31, 2026
Fund Details
| Key Dates | |
| Launch Date | 8/29/2011 |
| Last Annual Report Date | 12/31/2025 |
| Last Prospectus Date | 4/27/2026 |
| Share Classes | |
| LP40192274 | Inst |
| Attributes | |
| Index Fund |
|
| Inverse Fund | No |
| Leveraged Fund | -- |
| Fund of Funds | No |
| Currency Hedged Fund | -- |
| Socially Responsible Fund | No |
Top Portfolio Holders
| Name | % Weight |
|---|---|
| Portfolio A | 5.00% |
| Portfolio B | 3.50% |
| Portfolio C | 2.25% |