

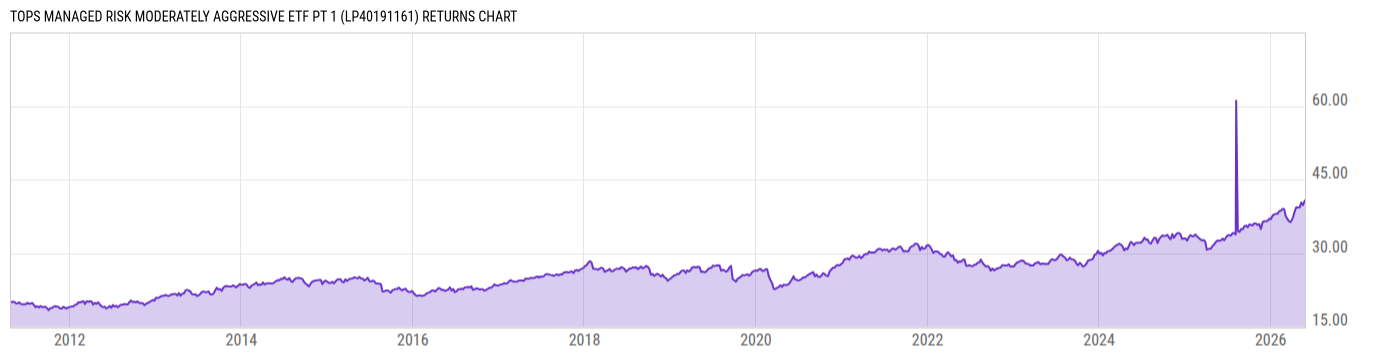
TOPS Managed Risk Moderately Aggressive ETF Pt 1 (LP40191161)
15.57
-0.02
(-0.13%)
USD |
May 27 2026
Returns Chart
Key Stats
| Net Expense Ratio | Total Assets Under Management | Weighted Average Dividend Yield | Turnover Ratio (Generic) |
|---|---|---|---|
| 0.50% | 174.92M | -- | 6.00% |
| 1 Year Fund Level Flows | 1 Year Total Returns (Daily) | Annualized Total Returns Since Inception (Daily) | Max Drawdown (Since Inception) |
| -17.89M | 25.13% |
Basic Info
| Investment Strategy | |
| The Fund seeks capital appreciation. Under normal market conditions the Fund will invest approximately 85% of its assets in a combination of equity, natural resource, and REIT ETFs and 15% in fixed income ETFs. |
| General | |
| Security Type | Insurance Fund |
| Equity Style | -- |
| Broad Asset Class | US Equity |
| Broad Category | Equity |
| Global Peer Group | Equity US |
| Peer Group | Multi-Cap Growth Funds |
| Global Macro | Equity North America |
| US Macro | Multi-Cap Funds |
| YCharts Categorization | -- |
| YCharts Benchmark | -- |
| Prospectus Objective | Growth Funds |
| Fund Owner Firm Name | TOPS |
| Broad Asset Class Benchmark Index | |
| ^SPXTR | 100.0% |
Net Fund Flows Versus Peer Group
1 Month
% Rank:
40
-4.249B
Peer Group Low
1.587B
Peer Group High
1 Year
% Rank:
40
-17.89M
-11.40B
Peer Group Low
8.101B
Peer Group High
3 Months
% Rank:
41
-4.109B
Peer Group Low
3.748B
Peer Group High
3 Years
% Rank:
40
-23.90B
Peer Group Low
15.29B
Peer Group High
6 Months
% Rank:
40
-6.359B
Peer Group Low
4.169B
Peer Group High
5 Years
% Rank:
58
-30.62B
Peer Group Low
17.21B
Peer Group High
YTD
% Rank:
41
-4.841B
Peer Group Low
3.748B
Peer Group High
10 Years
% Rank:
61
-42.13B
Peer Group Low
17.21B
Peer Group High
Date Unavailable
Risk
Performance Versus Peer Group
Annual Total Returns Versus Peers
As of May 28, 2026.
Asset Allocation
As of December 31, 2025.
| Type | % Net |
|---|---|
| Cash | 8.06% |
| Stock | 75.62% |
| Bond | 15.55% |
| Convertible | 0.00% |
| Preferred | 0.21% |
| Other | 0.56% |
Top 10 Holdings
| Name | % Weight | Price | % Change |
|---|---|---|---|
| Vanguard 500 Index Fund ETF | 18.86% | 693.76 | 0.55% |
| Vanguard Developed Markets Index Fund ETF | 15.34% | 71.65 | 0.34% |
| Invesco Government & Agency Portfolio Inst | 11.38% | 1.00 | 0.00% |
| State Street SPDR Portfolio S&P 400 Mid Cap ETF | 9.83% | 65.27 | 0.11% |
| State Street SPDR Portfolio S&P 600 Small Cap ETF | 5.33% | 54.35 | 0.07% |
| State Street SPDR Portfolio S&P 500 Value ETF | 4.49% | 61.16 | 0.11% |
| State Street SPDR Portfolio S&P 500 Growth ETF | 4.49% | 120.83 | 0.93% |
| Vanguard Emerging Markets Stock Index Fund ETF | 3.63% | 59.92 | -0.61% |
| iShares MSCI Emerging Markets ex China ETF | 3.63% | 101.06 | 0.63% |
| FlexShs Morningstar Glbl Upsteam Ntrl Res Idx Fd | 3.63% | 54.07 | 0.39% |
Fees & Availability
| Fees | |
| Actual 12B-1 Fee | -- |
| Actual Management Fee | 0.30% |
| Administration Fee | 5.12K% |
| Maximum Front Load | -- |
| Maximum Deferred Load | -- |
| Maximum Redemption Fee | -- |
| General Availability | |
| Available for Insurance Product |
|
| Available for RRSP | No |
| Purchase Details | |
| Open to New Investors |
|
| Minimum Initial Investment | 0.00 None |
| Minimum Subsequent Investment | 0.00 None |
Basic Info
| Investment Strategy | |
| The Fund seeks capital appreciation. Under normal market conditions the Fund will invest approximately 85% of its assets in a combination of equity, natural resource, and REIT ETFs and 15% in fixed income ETFs. |
| General | |
| Security Type | Insurance Fund |
| Equity Style | -- |
| Broad Asset Class | US Equity |
| Broad Category | Equity |
| Global Peer Group | Equity US |
| Peer Group | Multi-Cap Growth Funds |
| Global Macro | Equity North America |
| US Macro | Multi-Cap Funds |
| YCharts Categorization | -- |
| YCharts Benchmark | -- |
| Prospectus Objective | Growth Funds |
| Fund Owner Firm Name | TOPS |
| Broad Asset Class Benchmark Index | |
| ^SPXTR | 100.0% |
Fundamentals
| General | |
| Distribution Yield | -- |
| Dividend Yield TTM (5-27-26) | 2.10% |
| 30-Day SEC Yield | -- |
| 7-Day SEC Yield | -- |
| Number of Holdings | 28 |
| Stock | |
| Weighted Average PE Ratio | 28.98 |
| Weighted Average Price to Sales Ratio | 6.275 |
| Weighted Average Price to Book Ratio | 6.928 |
| Weighted Median ROE | 39.46% |
| Weighted Median ROA | 10.47% |
| ROI (TTM) | 16.67% |
| Return on Investment (TTM) | 16.67% |
| Earning Yield | 0.0474 |
| LT Debt / Shareholders Equity | 0.8767 |
| Number of Equity Holdings | 0 |
| Bond | |
| Yield to Maturity (12-31-25) | -- |
| Effective Duration | -- |
| Average Coupon | -- |
| Calculated Average Quality | -- |
| Effective Maturity | -- |
| Nominal Maturity | -- |
| Number of Bond Holdings | 0 |
As of December 31, 2025
Growth Metrics
| EPS Growth (1Y) | 24.86% |
| EPS Growth (3Y) | 12.05% |
| EPS Growth (5Y) | 16.52% |
| Sales Growth (1Y) | 12.31% |
| Sales Growth (3Y) | 11.45% |
| Sales Growth (5Y) | 12.20% |
| Sales per Share Growth (1Y) | 28.26% |
| Sales per Share Growth (3Y) | 11.28% |
| Operating Cash Flow - Growth Rate (3Y) | 15.55% |
As of December 31, 2025
Fund Details
| Key Dates | |
| Launch Date | 4/26/2011 |
| Last Annual Report Date | 12/31/2025 |
| Last Prospectus Date | 5/1/2026 |
| Share Classes | |
| LP40191162 | Other |
| LP40202290 | Other |
| LP40203984 | Other |
| LP40228642 | Inv |
| Attributes | |
| Index Fund | -- |
| Inverse Fund | No |
| Leveraged Fund | -- |
| Fund of Funds |
|
| Currency Hedged Fund | -- |
| Socially Responsible Fund | No |
Top Portfolio Holders
| Name | % Weight |
|---|---|
| Portfolio A | 5.00% |
| Portfolio B | 3.50% |
| Portfolio C | 2.25% |