

JNL/PIMCO Real Return Fund I (LP40113897)
12.91
0.00 (0.00%)
USD |
May 21 2026
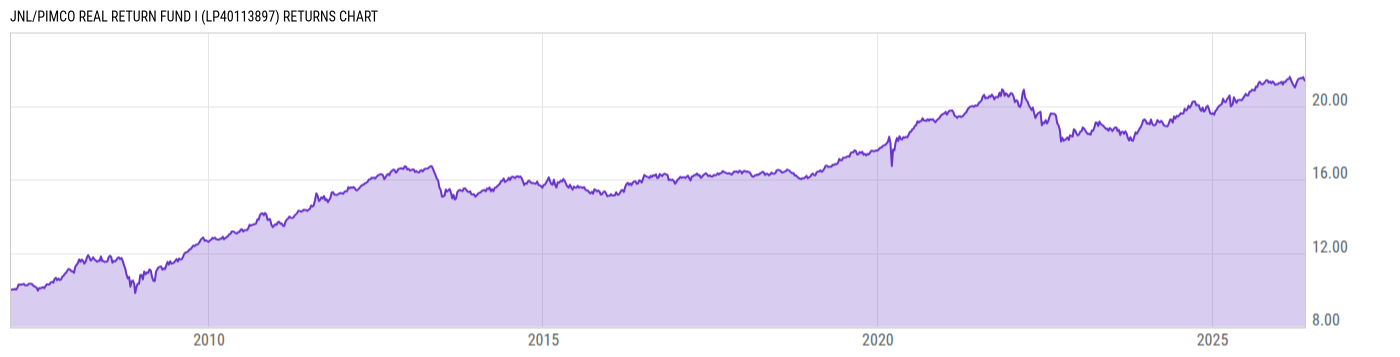
Returns Chart
Key Stats
| Net Expense Ratio | Total Assets Under Management | Weighted Average Dividend Yield | Turnover Ratio (Generic) |
|---|---|---|---|
| 0.49% | 1.066B | -- | 50.00% |
| 1 Year Fund Level Flows | 1 Year Total Returns (Daily) | Annualized Total Returns Since Inception (Daily) | Max Drawdown (Since Inception) |
| -100.89M | 6.08% |
Basic Info
| Investment Strategy | |
| The Fund seeks to maximize real return consistent with preservation of real capital and prudent investment management. The Fund is an actively managed bond portfolio that invests primarily in inflation indexed securities. |
| General | |
| Security Type | Insurance Fund |
| Equity Style | -- |
| Broad Asset Class | Taxable Bond |
| Broad Category | Fixed Income |
| Global Peer Group | Bond USD Inflation Linked |
| Peer Group | Inflation Protected Bond Funds |
| Global Macro | Bond HC |
| US Macro | Short-/Intermediate-Term U.S. Government & Treasury Funds |
| YCharts Categorization | -- |
| YCharts Benchmark | -- |
| Prospectus Objective | Inflation Protected Bond Funds |
| Fund Owner Firm Name | Jackson |
| Broad Asset Class Benchmark Index | |
| ^BBUSATR | 100.0% |
Net Fund Flows Versus Peer Group
1 Month
% Rank:
81
-469.45M
Peer Group Low
1.496B
Peer Group High
1 Year
% Rank:
77
-100.89M
-813.70M
Peer Group Low
6.677B
Peer Group High
3 Months
% Rank:
70
-1.012B
Peer Group Low
1.924B
Peer Group High
3 Years
% Rank:
76
-9.278B
Peer Group Low
16.21B
Peer Group High
6 Months
% Rank:
73
-1.086B
Peer Group Low
2.806B
Peer Group High
5 Years
% Rank:
80
-12.06B
Peer Group Low
16.21B
Peer Group High
YTD
% Rank:
76
-1.263B
Peer Group Low
2.544B
Peer Group High
10 Years
% Rank:
87
-6.388B
Peer Group Low
42.79B
Peer Group High
Date Unavailable
Risk
Performance Versus Peer Group
Annual Total Returns Versus Peers
As of May 24, 2026.
Asset Allocation
As of March 31, 2026.
| Type | % Net |
|---|---|
| Cash | -17.90% |
| Stock | 0.00% |
| Bond | 127.8% |
| Convertible | 0.00% |
| Preferred | 0.05% |
| Other | -9.98% |
Top 10 Holdings
| Name | % Weight | Price | % Change |
|---|---|---|---|
| United States of America USGB 0.625 07/15/2032 FIX USD Government | 7.78% | 93.53 | -0.29% |
| United States of America USGB 1.625 10/15/2029 FIX USD Government | 4.94% | 100.51 | -0.31% |
| United States of America USGB 0.5 01/15/2028 FIX USD Government | 4.91% | 98.58 | -0.23% |
| United States of America USGB 1.375 07/15/2033 FIX USD Government | 4.65% | 96.82 | -0.27% |
| United States of America USGB 1.75 01/15/2034 FIX USD Government | 4.26% | 98.47 | -0.21% |
| United States of America USGB 0.375 01/15/2027 FIX USD Government | 4.16% | 99.85 | -0.15% |
| United States of America USGB 0.375 07/15/2027 FIX USD Government | 4.10% | 99.47 | -0.18% |
| United States of America USGB 1.875 07/15/2034 FIX USD Government | 4.10% | 99.33 | -0.20% |
|
FEDERAL NATIONAL MORTGAGE ASSOCIATION 4.5% 01-JUN-2056
|
4.00% | -- | -- |
| United States of America USGB 1.625 04/15/2030 FIX USD Government | 3.97% | 99.92 | -0.33% |
Fees & Availability
| Fees | |
| Actual 12B-1 Fee | -- |
| Actual Management Fee | 0.39% |
| Administration Fee | 169.1K% |
| Maximum Front Load | -- |
| Maximum Deferred Load | -- |
| Maximum Redemption Fee | -- |
| General Availability | |
| Available for Insurance Product |
|
| Available for RRSP | No |
| Purchase Details | |
| Open to New Investors |
|
| Minimum Initial Investment | 0.00 None |
| Minimum Subsequent Investment | 0.00 None |
Basic Info
| Investment Strategy | |
| The Fund seeks to maximize real return consistent with preservation of real capital and prudent investment management. The Fund is an actively managed bond portfolio that invests primarily in inflation indexed securities. |
| General | |
| Security Type | Insurance Fund |
| Equity Style | -- |
| Broad Asset Class | Taxable Bond |
| Broad Category | Fixed Income |
| Global Peer Group | Bond USD Inflation Linked |
| Peer Group | Inflation Protected Bond Funds |
| Global Macro | Bond HC |
| US Macro | Short-/Intermediate-Term U.S. Government & Treasury Funds |
| YCharts Categorization | -- |
| YCharts Benchmark | -- |
| Prospectus Objective | Inflation Protected Bond Funds |
| Fund Owner Firm Name | Jackson |
| Broad Asset Class Benchmark Index | |
| ^BBUSATR | 100.0% |
Fundamentals
| General | |
| Distribution Yield | -- |
| Dividend Yield TTM (5-21-26) | 0.00% |
| 30-Day SEC Yield (4-30-26) | 0.84% |
| 7-Day SEC Yield | -- |
| Number of Holdings | 368 |
| Bond | |
| Yield to Maturity (3-31-26) | 2.16% |
| Effective Duration | 7.23 |
| Average Coupon | 2.07% |
| Calculated Average Quality | 1.952 |
| Effective Maturity | 10.48 |
| Nominal Maturity | 10.55 |
| Number of Bond Holdings | 247 |
As of March 31, 2026
Fund Details
| Key Dates | |
| Launch Date | 1/16/2007 |
| Last Annual Report Date | 12/31/2025 |
| Last Prospectus Date | 4/28/2025 |
| Share Classes | |
| LP40113896 | A |
| Attributes | |
| Index Fund | -- |
| Inverse Fund | No |
| Leveraged Fund | -- |
| Fund of Funds | No |
| Currency Hedged Fund | -- |
| Socially Responsible Fund | No |
Top Portfolio Holders
| Name | % Weight |
|---|---|
| Portfolio A | 5.00% |
| Portfolio B | 3.50% |
| Portfolio C | 2.25% |