

JNL/Mellon S&P 400 MidCap Index Fund I (LP40104047)
44.82
+0.09
(+0.20%)
USD |
Jun 08 2026
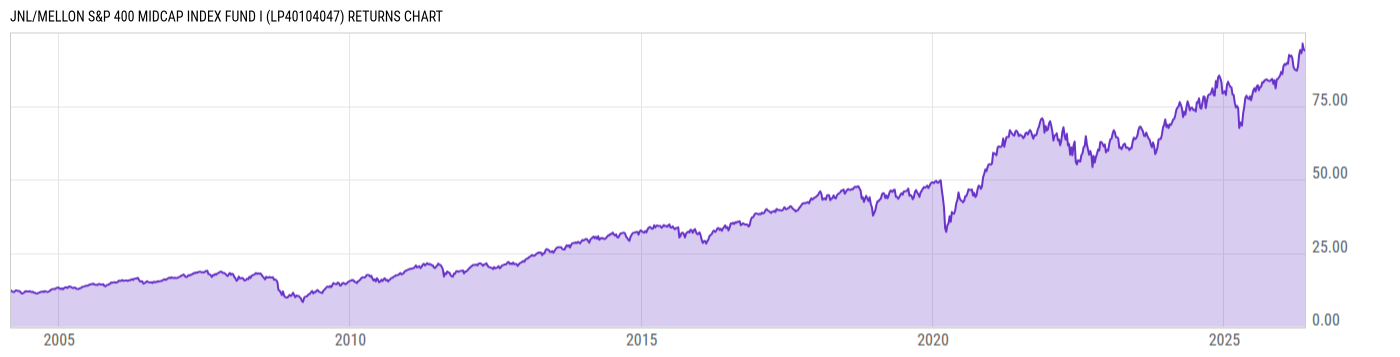
Returns Chart
Key Stats
| Net Expense Ratio | Total Assets Under Management | Weighted Average Dividend Yield | Turnover Ratio (Generic) |
|---|---|---|---|
| 0.26% | 3.507B | -- | 15.00% |
| 1 Year Fund Level Flows | 1 Year Total Returns (Daily) | Annualized Total Returns Since Inception (Daily) | Max Drawdown (Since Inception) |
| -406.19M | 22.66% |
Basic Info
| Investment Strategy | |
| The Fund seeks to closely match the returns and the characteristics of the Standard & Poors MidCap 400 Index (S&P MidCap 400 Index). |
| General | |
| Security Type | Insurance Fund |
| Equity Style | -- |
| Broad Asset Class | US Equity |
| Broad Category | Equity |
| Global Peer Group | Equity US Sm&Mid Cap |
| Peer Group | S&P Midcap 400 Index Funds |
| Global Macro | Equity North America |
| US Macro | Mid-Cap Funds |
| YCharts Categorization | -- |
| YCharts Benchmark | -- |
| Prospectus Objective | Mid-Cap Funds |
| Fund Owner Firm Name | Jackson |
| Broad Asset Class Benchmark Index | |
| ^SPXTR | 100.0% |
Net Fund Flows Versus Peer Group
1 Month
% Rank:
74
-197.79M
Peer Group Low
625.64M
Peer Group High
1 Year
% Rank:
88
-406.19M
-996.08M
Peer Group Low
3.436B
Peer Group High
3 Months
% Rank:
84
-202.53M
Peer Group Low
2.323B
Peer Group High
3 Years
% Rank:
89
-1.647B
Peer Group Low
13.49B
Peer Group High
6 Months
% Rank:
84
-328.74M
Peer Group Low
3.980B
Peer Group High
5 Years
% Rank:
84
-3.576B
Peer Group Low
18.56B
Peer Group High
YTD
% Rank:
84
-823.29M
Peer Group Low
3.046B
Peer Group High
10 Years
% Rank:
84
-9.809B
Peer Group Low
25.39B
Peer Group High
Date Unavailable
Risk
Performance Versus Peer Group
Annual Total Returns Versus Peers
As of June 10, 2026.
Asset Allocation
As of March 31, 2026.
| Type | % Net |
|---|---|
| Cash | 0.30% |
| Stock | 99.41% |
| Bond | 0.32% |
| Convertible | 0.00% |
| Preferred | 0.00% |
| Other | -0.04% |
Top 2 Holdings
| Name | % Weight | Price | % Change |
|---|---|---|---|
| JNL Mid Cap Index Fund I | 99.97% | 14.51 | 0.21% |
|
Other Assets less Liabilities
|
0.03% | -- | -- |
Fees & Availability
| Fees | |
| Actual 12B-1 Fee | -- |
| Actual Management Fee | 0.14% |
| Administration Fee | 81.05K% |
| Maximum Front Load | -- |
| Maximum Deferred Load | -- |
| Maximum Redemption Fee | -- |
| General Availability | |
| Available for Insurance Product |
|
| Available for RRSP | No |
| Purchase Details | |
| Open to New Investors |
|
| Minimum Initial Investment | 0.00 None |
| Minimum Subsequent Investment | 0.00 None |
Basic Info
| Investment Strategy | |
| The Fund seeks to closely match the returns and the characteristics of the Standard & Poors MidCap 400 Index (S&P MidCap 400 Index). |
| General | |
| Security Type | Insurance Fund |
| Equity Style | -- |
| Broad Asset Class | US Equity |
| Broad Category | Equity |
| Global Peer Group | Equity US Sm&Mid Cap |
| Peer Group | S&P Midcap 400 Index Funds |
| Global Macro | Equity North America |
| US Macro | Mid-Cap Funds |
| YCharts Categorization | -- |
| YCharts Benchmark | -- |
| Prospectus Objective | Mid-Cap Funds |
| Fund Owner Firm Name | Jackson |
| Broad Asset Class Benchmark Index | |
| ^SPXTR | 100.0% |
Fundamentals
| General | |
| Distribution Yield | -- |
| Dividend Yield TTM (6-8-26) | 0.00% |
| 30-Day SEC Yield | -- |
| 7-Day SEC Yield | -- |
| Number of Holdings | 2 |
| Stock | |
| Weighted Average PE Ratio | 29.61 |
| Weighted Average Price to Sales Ratio | 4.115 |
| Weighted Average Price to Book Ratio | 4.877 |
| Weighted Median ROE | 17.21% |
| Weighted Median ROA | 5.95% |
| ROI (TTM) | 9.65% |
| Return on Investment (TTM) | 9.65% |
| Earning Yield | 0.0486 |
| LT Debt / Shareholders Equity | 0.9194 |
| Number of Equity Holdings | 0 |
As of March 31, 2026
Growth Metrics
| EPS Growth (1Y) | 24.14% |
| EPS Growth (3Y) | 11.70% |
| EPS Growth (5Y) | 13.44% |
| Sales Growth (1Y) | 8.31% |
| Sales Growth (3Y) | 10.00% |
| Sales Growth (5Y) | 10.65% |
| Sales per Share Growth (1Y) | 10.93% |
| Sales per Share Growth (3Y) | 9.27% |
| Operating Cash Flow - Growth Rate (3Y) | 19.03% |
As of March 31, 2026
Fund Details
| Key Dates | |
| Launch Date | 3/5/2004 |
| Last Annual Report Date | 12/31/2025 |
| Last Prospectus Date | 4/27/2026 |
| Share Classes | |
| LP40054245 | A |
| Attributes | |
| Index Fund |
|
| Inverse Fund | No |
| Leveraged Fund | -- |
| Fund of Funds | No |
| Currency Hedged Fund | -- |
| Socially Responsible Fund | No |
Top Portfolio Holders
| Name | % Weight |
|---|---|
| Portfolio A | 5.00% |
| Portfolio B | 3.50% |
| Portfolio C | 2.25% |