

JNL/Mellon International Index Fund A (LP40054242)
21.96
-0.24
(-1.08%)
USD |
Jun 10 2026
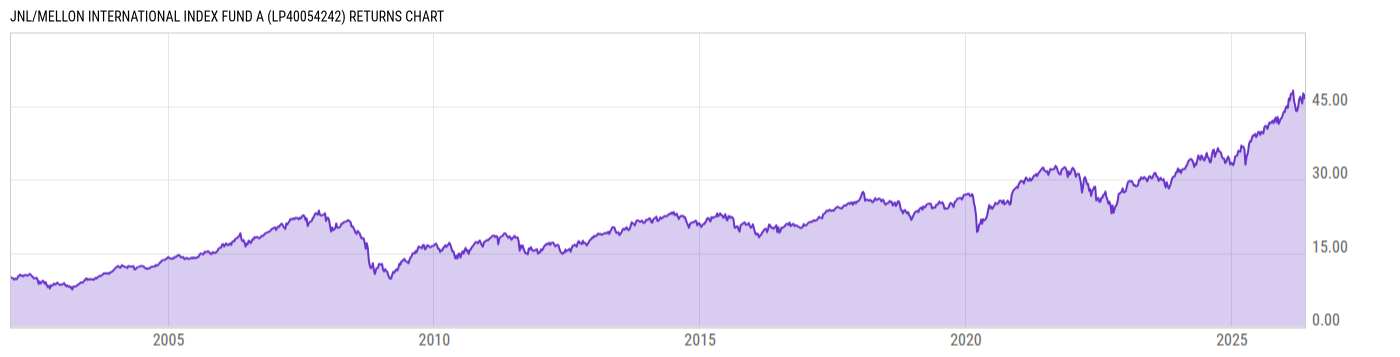
Returns Chart
Key Stats
| Net Expense Ratio | Total Assets Under Management | Weighted Average Dividend Yield | Turnover Ratio (Generic) |
|---|---|---|---|
| 0.61% | 2.997B | -- | 15.00% |
| 1 Year Fund Level Flows | 1 Year Total Returns (Daily) | Annualized Total Returns Since Inception (Daily) | Max Drawdown (Since Inception) |
| -465.65M | 17.12% |
Basic Info
| Investment Strategy | |
| The Fund seeks to invest at least 80% of its assets in the stocks included in the Morgan Stanley Capital International ("MSCI") Europe Australasia Far East ("EAFE") Index or derivative securities economically related to the MSCI EAFE Index. |
| General | |
| Security Type | Insurance Fund |
| Equity Style | -- |
| Broad Asset Class | International Equity |
| Broad Category | Equity |
| Global Peer Group | Equity Global ex US |
| Peer Group | International Multi-Cap Core |
| Global Macro | Equity Global |
| US Macro | Developed International Markets Funds |
| YCharts Categorization | -- |
| YCharts Benchmark | -- |
| Prospectus Objective | International Funds |
| Fund Owner Firm Name | Jackson |
| Broad Asset Class Benchmark Index | |
| ^MSACXUSNTR | 100.0% |
Net Fund Flows Versus Peer Group
1 Month
% Rank:
87
-646.86M
Peer Group Low
1.249B
Peer Group High
1 Year
% Rank:
90
-465.65M
-2.585B
Peer Group Low
21.10B
Peer Group High
3 Months
% Rank:
85
-549.38M
Peer Group Low
4.345B
Peer Group High
3 Years
% Rank:
87
-7.696B
Peer Group Low
38.72B
Peer Group High
6 Months
% Rank:
91
-1.564B
Peer Group Low
11.05B
Peer Group High
5 Years
% Rank:
88
-14.83B
Peer Group Low
61.92B
Peer Group High
YTD
% Rank:
89
-2.573B
Peer Group Low
7.616B
Peer Group High
10 Years
% Rank:
92
-43.26B
Peer Group Low
117.68B
Peer Group High
Date Unavailable
Risk
Performance Versus Peer Group
Annual Total Returns Versus Peers
As of June 11, 2026.
Asset Allocation
As of March 31, 2026.
| Type | % Net |
|---|---|
| Cash | 0.58% |
| Stock | 98.13% |
| Bond | 0.64% |
| Convertible | 0.00% |
| Preferred | 0.28% |
| Other | 0.37% |
Top 5 Holdings
| Name | % Weight | Price | % Change |
|---|---|---|---|
| JNL International Index Fund I | 99.95% | 13.07 | -1.06% |
|
Other Assets less Liabilities
|
0.05% | -- | -- |
|
USD Cash
|
0.00% | -- | -- |
|
EUR Cash
|
0.00% | -- | -- |
|
JPY Cash
|
0.00% | -- | -- |
Fees & Availability
| Fees | |
| Actual 12B-1 Fee | 0.30% |
| Actual Management Fee | 0.15% |
| Administration Fee | 3.97M% |
| Maximum Front Load | -- |
| Maximum Deferred Load | -- |
| Maximum Redemption Fee | -- |
| General Availability | |
| Available for Insurance Product |
|
| Available for RRSP | No |
| Purchase Details | |
| Open to New Investors |
|
| Minimum Initial Investment | 0.00 None |
| Minimum Subsequent Investment | 0.00 None |
Basic Info
| Investment Strategy | |
| The Fund seeks to invest at least 80% of its assets in the stocks included in the Morgan Stanley Capital International ("MSCI") Europe Australasia Far East ("EAFE") Index or derivative securities economically related to the MSCI EAFE Index. |
| General | |
| Security Type | Insurance Fund |
| Equity Style | -- |
| Broad Asset Class | International Equity |
| Broad Category | Equity |
| Global Peer Group | Equity Global ex US |
| Peer Group | International Multi-Cap Core |
| Global Macro | Equity Global |
| US Macro | Developed International Markets Funds |
| YCharts Categorization | -- |
| YCharts Benchmark | -- |
| Prospectus Objective | International Funds |
| Fund Owner Firm Name | Jackson |
| Broad Asset Class Benchmark Index | |
| ^MSACXUSNTR | 100.0% |
Fundamentals
| General | |
| Distribution Yield | -- |
| Dividend Yield TTM (6-10-26) | 0.00% |
| 30-Day SEC Yield | -- |
| 7-Day SEC Yield | -- |
| Number of Holdings | 5 |
| Stock | |
| Weighted Average PE Ratio | 23.53 |
| Weighted Average Price to Sales Ratio | 3.742 |
| Weighted Average Price to Book Ratio | 4.314 |
| Weighted Median ROE | 55.88% |
| Weighted Median ROA | 6.37% |
| ROI (TTM) | 11.99% |
| Return on Investment (TTM) | 11.99% |
| Earning Yield | 0.0544 |
| LT Debt / Shareholders Equity | 0.7541 |
| Number of Equity Holdings | 0 |
As of March 31, 2026
Growth Metrics
| EPS Growth (1Y) | 14.20% |
| EPS Growth (3Y) | 11.62% |
| EPS Growth (5Y) | 13.37% |
| Sales Growth (1Y) | 5.79% |
| Sales Growth (3Y) | 7.53% |
| Sales Growth (5Y) | 6.63% |
| Sales per Share Growth (1Y) | 7.33% |
| Sales per Share Growth (3Y) | 8.53% |
| Operating Cash Flow - Growth Rate (3Y) | 6.82% |
As of March 31, 2026
Fund Details
| Key Dates | |
| Launch Date | 1/15/2002 |
| Last Annual Report Date | 12/31/2025 |
| Last Prospectus Date | 4/27/2026 |
| Share Classes | |
| LP40104046 | Inst |
| Attributes | |
| Index Fund |
|
| Inverse Fund | No |
| Leveraged Fund | -- |
| Fund of Funds | No |
| Currency Hedged Fund | -- |
| Socially Responsible Fund | No |
Top Portfolio Holders
| Name | % Weight |
|---|---|
| Portfolio A | 5.00% |
| Portfolio B | 3.50% |
| Portfolio C | 2.25% |