

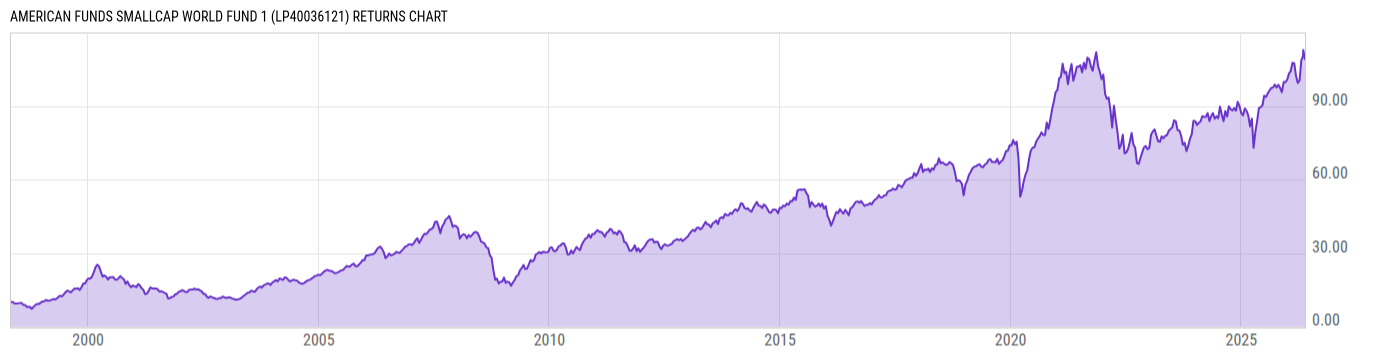
American Funds SMALLCAP World Fund 1 (LP40036121)
19.04
+0.09
(+0.47%)
USD |
Jun 09 2026
Returns Chart
Key Stats
| Net Expense Ratio | Total Assets Under Management | Weighted Average Dividend Yield | Turnover Ratio (Generic) |
|---|---|---|---|
| 0.65% | 2.460B | 1.38% | 51.00% |
| 1 Year Fund Level Flows | 1 Year Total Returns (Daily) | Annualized Total Returns Since Inception (Daily) | Max Drawdown (Since Inception) |
| -1.136B | 20.40% |
Basic Info
| Investment Strategy | |
| The Fund seeks long-term growth of capital. The fund invests at least 80% of its net assets in growth-oriented common stocks and other equity type securities of companies with small market capitalizations, included in the MSCI All Country World Small Cap Index or the Russell 2000 Index, measured at the time of purchase. |
| General | |
| Security Type | Insurance Fund |
| Equity Style | Mid Cap Growth |
| Broad Asset Class | International Equity |
| Broad Category | Equity |
| Global Peer Group | Equity Global Sm&Mid Cap |
| Peer Group | Global Small-/Mid-Cap Funds |
| Global Macro | Equity Global |
| US Macro | Developed Global Markets Funds |
| YCharts Categorization | -- |
| YCharts Benchmark | -- |
| Prospectus Objective | Global Small-Cap Funds |
| Fund Owner Firm Name | Capital Group/American Funds |
| Broad Asset Class Benchmark Index | |
| ^MSACXUSNTR | 100.0% |
Net Fund Flows Versus Peer Group
1 Month
% Rank:
99
-661.36M
Peer Group Low
262.67M
Peer Group High
1 Year
% Rank:
85
-1.136B
-2.427B
Peer Group Low
378.09M
Peer Group High
3 Months
% Rank:
85
-798.34M
Peer Group Low
21.79M
Peer Group High
3 Years
% Rank:
80
-2.641B
Peer Group Low
462.91M
Peer Group High
6 Months
% Rank:
85
-2.398B
Peer Group Low
154.18M
Peer Group High
5 Years
% Rank:
94
-12.29B
Peer Group Low
2.259B
Peer Group High
YTD
% Rank:
85
-1.536B
Peer Group Low
78.30M
Peer Group High
10 Years
% Rank:
99
-13.28B
Peer Group Low
14.48B
Peer Group High
Date Unavailable
Risk
Performance Versus Peer Group
Annual Total Returns Versus Peers
As of June 10, 2026.
Asset Allocation
As of March 31, 2026.
| Type | % Net |
|---|---|
| Cash | 5.09% |
| Stock | 94.36% |
| Bond | 0.18% |
| Convertible | 0.00% |
| Preferred | 0.48% |
| Other | -0.12% |
Top 10 Holdings
| Name | % Weight | Price | % Change |
|---|---|---|---|
|
Capital Group Central Cash Fund; Class M
|
5.09% | -- | -- |
| Resonac Holdings Corp. | 1.92% | 101.00 | -1.37% |
| International Container Terminal Services, Inc. | 1.49% | 14.68 | 0.00% |
| Celanese Corp. | 1.45% | 50.39 | -1.04% |
| ATI, Inc. | 1.37% | 183.46 | -1.96% |
| Modine Manufacturing Co. | 1.26% | 258.47 | -7.09% |
|
Raia Drogasil S/A ORD
|
1.22% | -- | -- |
| Weatherford International plc | 1.21% | 97.99 | -3.23% |
| Lattice Semiconductor Corp. | 1.18% | 132.42 | -3.74% |
| MACOM Technology Solutions Holdings, Inc. | 1.14% | 354.28 | -1.24% |
Fees & Availability
| Fees | |
| Actual 12B-1 Fee | -- |
| Actual Management Fee | 0.60% |
| Administration Fee | -- |
| Maximum Front Load | -- |
| Maximum Deferred Load | -- |
| Maximum Redemption Fee | -- |
| General Availability | |
| Available for Insurance Product |
|
| Available for RRSP | No |
| Purchase Details | |
| Open to New Investors |
|
| Minimum Initial Investment | 0.00 None |
| Minimum Subsequent Investment | 0.00 None |
Basic Info
| Investment Strategy | |
| The Fund seeks long-term growth of capital. The fund invests at least 80% of its net assets in growth-oriented common stocks and other equity type securities of companies with small market capitalizations, included in the MSCI All Country World Small Cap Index or the Russell 2000 Index, measured at the time of purchase. |
| General | |
| Security Type | Insurance Fund |
| Equity Style | Mid Cap Growth |
| Broad Asset Class | International Equity |
| Broad Category | Equity |
| Global Peer Group | Equity Global Sm&Mid Cap |
| Peer Group | Global Small-/Mid-Cap Funds |
| Global Macro | Equity Global |
| US Macro | Developed Global Markets Funds |
| YCharts Categorization | -- |
| YCharts Benchmark | -- |
| Prospectus Objective | Global Small-Cap Funds |
| Fund Owner Firm Name | Capital Group/American Funds |
| Broad Asset Class Benchmark Index | |
| ^MSACXUSNTR | 100.0% |
Fundamentals
| General | |
| Distribution Yield | -- |
| Dividend Yield TTM (6-9-26) | 1.96% |
| 30-Day SEC Yield (4-30-26) | 0.71% |
| 7-Day SEC Yield | -- |
| Number of Holdings | 276 |
| Stock | |
| Weighted Average PE Ratio | 30.20 |
| Weighted Average Price to Sales Ratio | 5.451 |
| Weighted Average Price to Book Ratio | 5.537 |
| Weighted Median ROE | 9.84% |
| Weighted Median ROA | 4.12% |
| ROI (TTM) | 7.30% |
| Return on Investment (TTM) | 7.30% |
| Earning Yield | 0.1798 |
| LT Debt / Shareholders Equity | 1.100 |
| Number of Equity Holdings | 269 |
As of March 31, 2026
Growth Metrics
| EPS Growth (1Y) | 17.90% |
| EPS Growth (3Y) | 12.48% |
| EPS Growth (5Y) | 15.84% |
| Sales Growth (1Y) | 12.44% |
| Sales Growth (3Y) | 9.41% |
| Sales Growth (5Y) | 12.87% |
| Sales per Share Growth (1Y) | 1.56K% |
| Sales per Share Growth (3Y) | 22.65% |
| Operating Cash Flow - Growth Rate (3Y) | 18.14% |
As of March 31, 2026
Fund Details
| Key Dates | |
| Launch Date | 4/30/1998 |
| Last Annual Report Date | 12/31/2025 |
| Last Prospectus Date | 5/1/2026 |
| Share Classes | |
| LP40036123 | Other |
| LP40202193 | Other |
| LP40217839 | Other |
| Attributes | |
| Index Fund | -- |
| Inverse Fund | No |
| Leveraged Fund | -- |
| Fund of Funds | No |
| Currency Hedged Fund | -- |
| Socially Responsible Fund | No |
Top Portfolio Holders
| Name | % Weight |
|---|---|
| Portfolio A | 5.00% |
| Portfolio B | 3.50% |
| Portfolio C | 2.25% |