

DWS Money Market Prime Series Money Market (KMMXX)
1.00
0.00 (0.00%)
USD |
Jun 09 2026
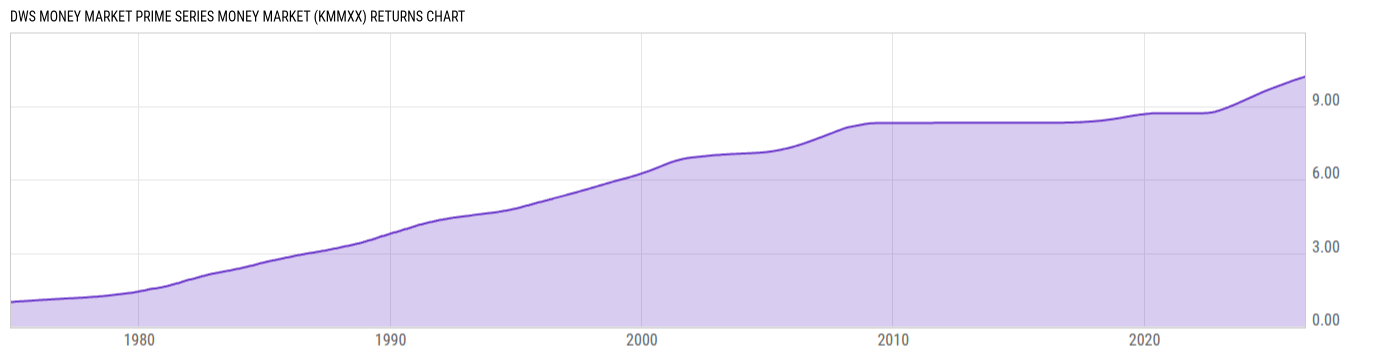
Returns Chart
Key Stats
| Net Expense Ratio | Total Assets Under Management | Weighted Average Dividend Yield | Turnover Ratio (Generic) |
|---|---|---|---|
| 0.57% | 545.98M | -- | -- |
| 1 Year Fund Level Flows | 1 Year Total Returns (Daily) | Annualized Total Returns Since Inception (Daily) | Max Drawdown (Since Inception) |
| -41.32M | 3.49% |
Basic Info
| Investment Strategy | |
| The Fund seeks maximum current income to the extent consistent with stability of principal. The Fund invests in high quality, short term, US dollar denominated money market instruments paying a fixed, variable or floating interest rate which include debt obligations, US Government securities, and repurchase agreements. |
| General | |
| Security Type | Money Market Fund |
| Equity Style | -- |
| Broad Asset Class | Money Market |
| Broad Category | Capital Preservation |
| Global Peer Group | Money Market USD |
| Peer Group | Money Market Funds |
| Global Macro | Money Market HC |
| US Macro | Taxable Money Market Funds |
| YCharts Categorization | -- |
| YCharts Benchmark | -- |
| Prospectus Objective | Money Market Funds |
| Fund Owner Firm Name | DWS |
| Broad Asset Class Benchmark Index | |
| ^BBUTB13MTR | 100.0% |
Net Fund Flows Versus Peer Group
1 Month
% Rank:
60
-461.26M
Peer Group Low
1.539B
Peer Group High
1 Year
% Rank:
70
-41.32M
-8.251B
Peer Group Low
14.16B
Peer Group High
3 Months
% Rank:
30
-4.836B
Peer Group Low
83.19M
Peer Group High
3 Years
% Rank:
91
-1.574B
Peer Group Low
154.90B
Peer Group High
6 Months
% Rank:
36
-5.502B
Peer Group Low
149.91M
Peer Group High
5 Years
% Rank:
93
-2.118B
Peer Group Low
271.50B
Peer Group High
YTD
% Rank:
28
-6.442B
Peer Group Low
80.60M
Peer Group High
10 Years
% Rank:
92
-39.66B
Peer Group Low
336.94B
Peer Group High
Date Unavailable
Risk
Performance Versus Peer Group
Annual Total Returns Versus Peers
As of June 11, 2026.
Asset Allocation
As of March 31, 2026.
| Type | % Net |
|---|---|
| Cash | 82.41% |
| Stock | 0.00% |
| Bond | 16.94% |
| Convertible | 0.00% |
| Preferred | 0.00% |
| Other | 0.65% |
Top 10 Holdings
| Name | % Weight | Price | % Change |
|---|---|---|---|
|
Wells Fargo Bank NA Repo
|
14.74% | -- | -- |
|
Royal Bank of Canada Repo
|
14.46% | -- | -- |
| 04/08/2026 (Matured) | 4.85% | 100.00 | 0.00% |
|
BNP Paribas SA Repo
|
4.41% | -- | -- |
|
Canadian Imperial Bank of Commerce Time/Term Deposits
|
4.41% | -- | -- |
|
Mizuho Bank Ltd (New York Branch) Time/Term Deposit
|
4.41% | -- | -- |
| NORTH TEX HIGHER ED AUTH INC STUDENT LN REV TX 3.720 02/01/2056 | 3.53% | 100.00 | 0.00% |
| ISSAQUAH GATEWAY SR DEVELOPMENT, LLC ISSAGAT 11/01/2057 FLT USD Corporate (Called) | 1.94% | -- | -- |
| TARRANT CNTY TEX CULTURAL ED FACS FIN CORP HOSP REV TX 2.500 11/15/2063 | 1.76% | 100.00 | 0.00% |
| ALASKA ST HSG FIN CORP AK 3.720 12/01/2047 | 1.35% | 100.00 | 0.00% |
Fees & Availability
| Fees | |
| Actual 12B-1 Fee | -- |
| Actual Management Fee | 0.29% |
| Administration Fee | 382.0K% |
| Maximum Front Load | -- |
| Maximum Deferred Load | -- |
| Maximum Redemption Fee | -- |
| General Availability | |
| Available for Insurance Product | No |
| Available for RRSP | No |
| Purchase Details | |
| Open to New Investors | No |
| Minimum Initial Investment | 1000.00 None |
| Minimum Subsequent Investment | 50.00 None |
Basic Info
| Investment Strategy | |
| The Fund seeks maximum current income to the extent consistent with stability of principal. The Fund invests in high quality, short term, US dollar denominated money market instruments paying a fixed, variable or floating interest rate which include debt obligations, US Government securities, and repurchase agreements. |
| General | |
| Security Type | Money Market Fund |
| Equity Style | -- |
| Broad Asset Class | Money Market |
| Broad Category | Capital Preservation |
| Global Peer Group | Money Market USD |
| Peer Group | Money Market Funds |
| Global Macro | Money Market HC |
| US Macro | Taxable Money Market Funds |
| YCharts Categorization | -- |
| YCharts Benchmark | -- |
| Prospectus Objective | Money Market Funds |
| Fund Owner Firm Name | DWS |
| Broad Asset Class Benchmark Index | |
| ^BBUTB13MTR | 100.0% |
Fundamentals
| General | |
| Distribution Yield | -- |
| Dividend Yield TTM (6-9-26) | 3.53% |
| 30-Day SEC Yield | -- |
| 7-Day SEC Yield (4-30-26) | 3.22% |
| Number of Holdings | 70 |
| Bond | |
| Yield to Maturity (3-31-26) | -- |
| Effective Duration | -- |
| Average Coupon | -- |
| Calculated Average Quality | -- |
| Effective Maturity | -- |
| Nominal Maturity | -- |
| Number of Bond Holdings | 23 |
As of March 31, 2026
Fund Details
Top Portfolio Holders
| Name | % Weight |
|---|---|
| Portfolio A | 5.00% |
| Portfolio B | 3.50% |
| Portfolio C | 2.25% |