

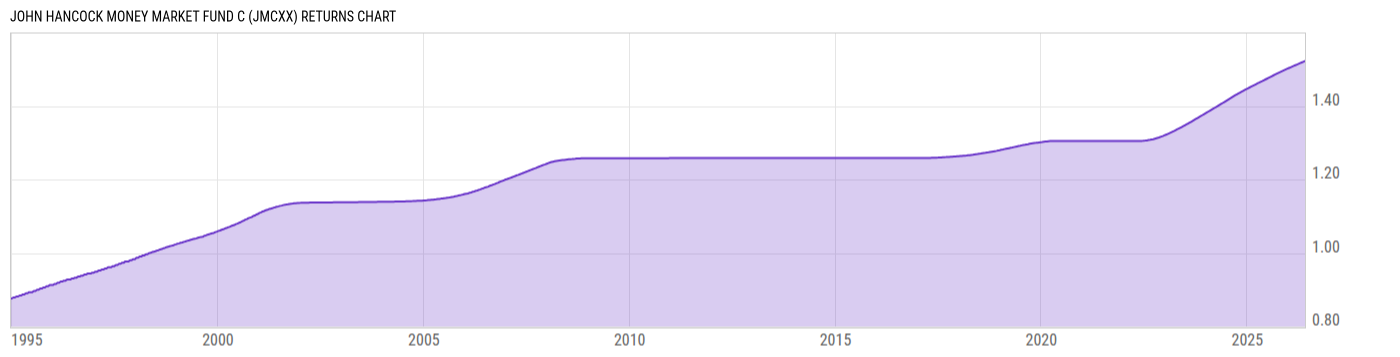
John Hancock Money Market Fund C (JMCXX)
1.00
0.00 (0.00%)
USD |
May 28 2026
Returns Chart
Key Stats
| Net Expense Ratio | Total Assets Under Management | Weighted Average Dividend Yield | Turnover Ratio (Generic) |
|---|---|---|---|
| 0.51% | 1.521B | -- | -- |
| 1 Year Fund Level Flows | 1 Year Total Returns (Daily) | Annualized Total Returns Since Inception (Daily) | Max Drawdown (Since Inception) |
| -4.370M | 3.56% |
Basic Info
| Investment Strategy | |
| The Fund seeks maximum current income that is consistent with maintaining liquidity & preserving capital. Under normal market conditions, the Fund invests at least 99.5% of its total assets in cash, U.S. Government securities and/or repurchase agreements that are fully collateralized by U.S. Government securities or cash. |
| General | |
| Security Type | Money Market Fund |
| Equity Style | -- |
| Broad Asset Class | Money Market |
| Broad Category | Capital Preservation |
| Global Peer Group | Money Market USD |
| Peer Group | U.S. Government Money Market Funds |
| Global Macro | Money Market HC |
| US Macro | Taxable Money Market Funds |
| YCharts Categorization | -- |
| YCharts Benchmark | -- |
| Prospectus Objective | U.S. Government Money Market Funds |
| Fund Owner Firm Name | John Hancock Group |
| Broad Asset Class Benchmark Index | |
| ^BBUTB13MTR | 100.0% |
Net Fund Flows Versus Peer Group
1 Month
% Rank:
16
-9.014B
Peer Group Low
5.994B
Peer Group High
1 Year
% Rank:
42
-4.370M
-2.041B
Peer Group Low
41.97B
Peer Group High
3 Months
% Rank:
28
-20.50B
Peer Group Low
11.15B
Peer Group High
3 Years
% Rank:
57
-3.408B
Peer Group Low
155.04B
Peer Group High
6 Months
% Rank:
37
-8.810B
Peer Group Low
19.16B
Peer Group High
5 Years
% Rank:
47
-18.90B
Peer Group Low
186.38B
Peer Group High
YTD
% Rank:
40
-15.02B
Peer Group Low
4.720B
Peer Group High
10 Years
% Rank:
46
-13.75B
Peer Group Low
339.01B
Peer Group High
Date Unavailable
Risk
Performance Versus Peer Group
Annual Total Returns Versus Peers
As of May 29, 2026.
Asset Allocation
As of February 28, 2026.
| Type | % Net |
|---|---|
| Cash | 39.87% |
| Stock | 0.00% |
| Bond | 60.57% |
| Convertible | 0.00% |
| Preferred | 0.00% |
| Other | -0.44% |
Top 10 Holdings
| Name | % Weight | Price | % Change |
|---|---|---|---|
|
Fixed Income Clearing Corp Repo
|
21.22% | -- | -- |
|
Goldman Sachs Group Inc Repo
|
10.91% | -- | -- |
| United States of America USGB 04/30/2027 FLT USD Government | 4.46% | 100.12 | -0.02% |
| United States of America USGB 07/31/2026 FLT USD Government | 3.33% | 100.00 | 0.00% |
| Federal Home Loan Banks FHLB 04/08/2026 FIX USD Agency (Matured) | 2.66% | 99.99 | 0.01% |
| Federal Agricultural Mortgage Corporation FAMCA 09/11/2026 FLT USD Agency | 1.86% | -- | -- |
| Federal Home Loan Banks FHLB 04/22/2026 FIX USD Agency (Matured) | 1.37% | -- | -- |
| Federal Agricultural Mortgage Corporation FAMCA 4.08 07/10/2026 FIX USD Agency | 1.33% | -- | -- |
| Federal Farm Credit Banks Funding Corporation FFCB 04/14/2026 FIX USD Agency (Matured) | 1.33% | -- | -- |
| Federal Agricultural Mortgage Corporation FAMCA 05/04/2026 FIX USD Agency (Matured) | 1.20% | -- | -- |
Fees & Availability
| Fees | |
| Actual 12B-1 Fee | 1.00% |
| Actual Management Fee | -- |
| Administration Fee | -- |
| Maximum Front Load | 0.00% |
| Maximum Deferred Load | 1.00% |
| Maximum Redemption Fee | -- |
| General Availability | |
| Available for Insurance Product | No |
| Available for RRSP | No |
| Purchase Details | |
| Open to New Investors | No |
| Minimum Initial Investment | 1000.00 None |
| Minimum Subsequent Investment | 0.00 None |
Basic Info
| Investment Strategy | |
| The Fund seeks maximum current income that is consistent with maintaining liquidity & preserving capital. Under normal market conditions, the Fund invests at least 99.5% of its total assets in cash, U.S. Government securities and/or repurchase agreements that are fully collateralized by U.S. Government securities or cash. |
| General | |
| Security Type | Money Market Fund |
| Equity Style | -- |
| Broad Asset Class | Money Market |
| Broad Category | Capital Preservation |
| Global Peer Group | Money Market USD |
| Peer Group | U.S. Government Money Market Funds |
| Global Macro | Money Market HC |
| US Macro | Taxable Money Market Funds |
| YCharts Categorization | -- |
| YCharts Benchmark | -- |
| Prospectus Objective | U.S. Government Money Market Funds |
| Fund Owner Firm Name | John Hancock Group |
| Broad Asset Class Benchmark Index | |
| ^BBUTB13MTR | 100.0% |
Fundamentals
| General | |
| Distribution Yield | -- |
| Dividend Yield TTM (5-28-26) | 3.55% |
| 30-Day SEC Yield | -- |
| 7-Day SEC Yield (4-30-26) | 3.26% |
| Number of Holdings | 107 |
| Bond | |
| Yield to Maturity (2-28-26) | -- |
| Effective Duration | -- |
| Average Coupon | -- |
| Calculated Average Quality | -- |
| Effective Maturity | -- |
| Nominal Maturity | -- |
| Number of Bond Holdings | 99 |
As of February 28, 2026
Fund Details
| Key Dates | |
| Launch Date | 5/1/1998 |
| Last Annual Report Date | 3/31/2025 |
| Last Prospectus Date | 8/1/2025 |
| Share Classes | |
| JHMXX | A |
| Attributes | |
| Index Fund | -- |
| Inverse Fund | No |
| Leveraged Fund | -- |
| Fund of Funds | No |
| Currency Hedged Fund | -- |
| Socially Responsible Fund | No |
Top Portfolio Holders
| Name | % Weight |
|---|---|
| Portfolio A | 5.00% |
| Portfolio B | 3.50% |
| Portfolio C | 2.25% |