

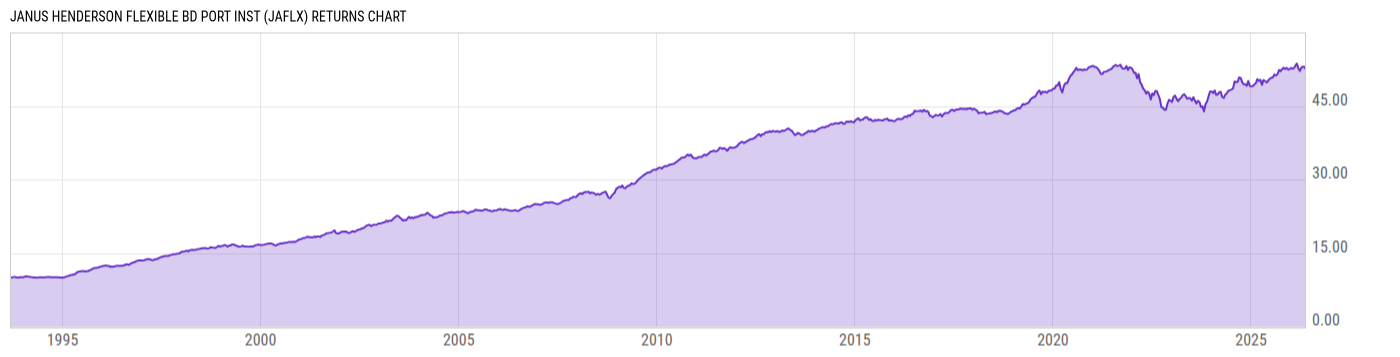
Janus Henderson Flexible Bd Port Inst (JAFLX)
9.94
-0.02
(-0.20%)
USD |
Jun 03 2026
Returns Chart
Key Stats
| Net Expense Ratio | Total Assets Under Management | Weighted Average Dividend Yield | Turnover Ratio (Generic) |
|---|---|---|---|
| 0.57% | 622.76M | -- | 177.0% |
| 1 Year Fund Level Flows | 1 Year Total Returns (Daily) | Annualized Total Returns Since Inception (Daily) | Max Drawdown (Since Inception) |
| -16.55M | 5.24% |
Basic Info
| Investment Strategy | |
| The Fund seeks to obtain maximum total return, consistent with preservation of capital. The Fund will invest at least 80% of its assets in income-producing securities. The Fund invests primarily in investment grade debt securities and will maintain a dollar-weighted average portfolio maturity of five to ten years. |
| General | |
| Security Type | Insurance Fund |
| Equity Style | -- |
| Broad Asset Class | Taxable Bond |
| Broad Category | Fixed Income |
| Global Peer Group | Bond USD Medium Term |
| Peer Group | Core Plus Bond Funds |
| Global Macro | Bond HC |
| US Macro | Short/Intermediate Investment-Grade Funds |
| YCharts Categorization | -- |
| YCharts Benchmark | -- |
| Prospectus Objective | Core Bond Funds |
| Fund Owner Firm Name | Janus Henderson Investors |
| Broad Asset Class Benchmark Index | |
| ^BBUSATR | 100.0% |
Net Fund Flows Versus Peer Group
1 Month
% Rank:
42
-355.03M
Peer Group Low
955.84M
Peer Group High
1 Year
% Rank:
60
-16.55M
-5.342B
Peer Group Low
5.732B
Peer Group High
3 Months
% Rank:
63
-1.705B
Peer Group Low
2.082B
Peer Group High
3 Years
% Rank:
60
-38.35B
Peer Group Low
16.67B
Peer Group High
6 Months
% Rank:
59
-3.114B
Peer Group Low
3.559B
Peer Group High
5 Years
% Rank:
53
-53.42B
Peer Group Low
16.59B
Peer Group High
YTD
% Rank:
62
-2.227B
Peer Group Low
3.045B
Peer Group High
10 Years
% Rank:
71
-55.60B
Peer Group Low
35.16B
Peer Group High
Date Unavailable
Risk
Performance Versus Peer Group
Annual Total Returns Versus Peers
As of June 04, 2026.
Asset Allocation
As of March 31, 2026.
| Type | % Net |
|---|---|
| Cash | 0.07% |
| Stock | 0.00% |
| Bond | 92.72% |
| Convertible | 0.00% |
| Preferred | 0.00% |
| Other | 7.21% |
Top 10 Holdings
| Name | % Weight | Price | % Change |
|---|---|---|---|
|
Janus Cash Liquidity LLC
|
5.86% | -- | -- |
|
United Kingdom of Great Britain and Northern Ireland (Government) 4.125% 07-MAR-2031
|
2.21% | -- | -- |
| United States of America USGB 3.875 03/31/2031 FIX USD Government | 2.06% | 98.70 | -0.13% |
| FEDERAL NATIONAL MORTGAGE ASSOCIATION FNMA-New 6.0 04/15/2033 FIX USD Agency | 1.97% | 102.24 | 0.05% |
| United States of America USGB 3.375 11/30/2027 FIX USD Government | 1.63% | 99.04 | -0.04% |
| United States of America USGB 4.625 11/15/2055 FIX USD Government | 1.51% | 94.29 | -0.33% |
| United States of America USGB 4.625 02/15/2046 FIX USD Government | 1.40% | 95.29 | -0.36% |
|
Federal National Mortgage Association 5% 01-MAY-2056
|
1.28% | -- | -- |
| Janus Henderson Emerging Markets Debt Hard Cur ETF | 1.23% | 53.60 | -0.22% |
| APPLOVIN CORPORATION APPLOCO 5.5 12/01/2034 FIX USD Corporate | 0.81% | 100.61 | -0.26% |
Fees & Availability
| Fees | |
| Actual 12B-1 Fee | -- |
| Actual Management Fee | 0.43% |
| Administration Fee | -- |
| Maximum Front Load | -- |
| Maximum Deferred Load | -- |
| Maximum Redemption Fee | -- |
| General Availability | |
| Available for Insurance Product |
|
| Available for RRSP | No |
| Purchase Details | |
| Open to New Investors |
|
| Minimum Initial Investment | 0.00 None |
| Minimum Subsequent Investment | 0.00 None |
Basic Info
| Investment Strategy | |
| The Fund seeks to obtain maximum total return, consistent with preservation of capital. The Fund will invest at least 80% of its assets in income-producing securities. The Fund invests primarily in investment grade debt securities and will maintain a dollar-weighted average portfolio maturity of five to ten years. |
| General | |
| Security Type | Insurance Fund |
| Equity Style | -- |
| Broad Asset Class | Taxable Bond |
| Broad Category | Fixed Income |
| Global Peer Group | Bond USD Medium Term |
| Peer Group | Core Plus Bond Funds |
| Global Macro | Bond HC |
| US Macro | Short/Intermediate Investment-Grade Funds |
| YCharts Categorization | -- |
| YCharts Benchmark | -- |
| Prospectus Objective | Core Bond Funds |
| Fund Owner Firm Name | Janus Henderson Investors |
| Broad Asset Class Benchmark Index | |
| ^BBUSATR | 100.0% |
Fundamentals
| General | |
| Distribution Yield | -- |
| Dividend Yield TTM (6-2-26) | 5.33% |
| 30-Day SEC Yield (4-30-26) | 4.49% |
| 7-Day SEC Yield | -- |
| Number of Holdings | 669 |
| Bond | |
| Yield to Maturity (3-31-26) | 5.27% |
| Effective Duration | 6.01 |
| Average Coupon | 5.24% |
| Calculated Average Quality | 2.706 |
| Effective Maturity | 16.18 |
| Nominal Maturity | 16.20 |
| Number of Bond Holdings | 638 |
As of March 31, 2026
Fund Details
| Key Dates | |
| Launch Date | 9/13/1993 |
| Last Annual Report Date | 12/31/2025 |
| Last Prospectus Date | 4/30/2026 |
| Share Classes | |
| LP40053386 | Service |
| Attributes | |
| Index Fund | -- |
| Inverse Fund | No |
| Leveraged Fund | -- |
| Fund of Funds | No |
| Currency Hedged Fund | -- |
| Socially Responsible Fund | No |
Top Portfolio Holders
| Name | % Weight |
|---|---|
| Portfolio A | 5.00% |
| Portfolio B | 3.50% |
| Portfolio C | 2.25% |