

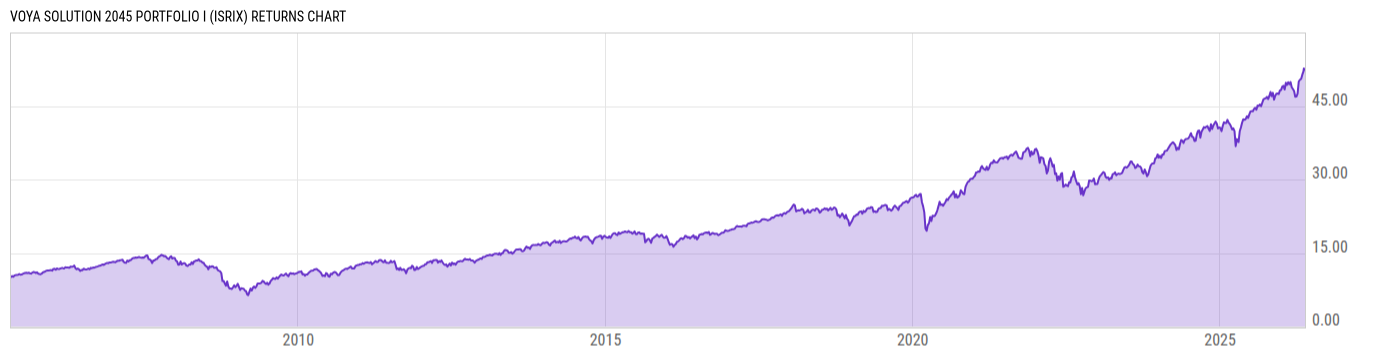
Voya Solution 2045 Portfolio I (ISRIX)
13.23
+0.01
(+0.08%)
USD |
Jun 09 2026
Returns Chart
Key Stats
| Net Expense Ratio | Total Assets Under Management | Weighted Average Dividend Yield | Turnover Ratio (Generic) |
|---|---|---|---|
| 0.75% | 528.16M | -- | 31.00% |
| 1 Year Fund Level Flows | 1 Year Total Returns (Daily) | Annualized Total Returns Since Inception (Daily) | Max Drawdown (Since Inception) |
| -34.90M | 22.11% |
Basic Info
| Investment Strategy | |
| The Fund seeks to provide a combination of total return and stability of principal consistent with an asset allocation targeted to retirement. The Fund invests in a combination of underlying funds and seeks to maintain a target allocation of 90% in equity securities and 10% in fixed income securities. |
| General | |
| Security Type | Insurance Fund |
| Equity Style | -- |
| Broad Asset Class | Allocation |
| Broad Category | Allocation |
| Global Peer Group | Target Maturity MA USD 2045 |
| Peer Group | Mixed-Asset Target 2045 Funds |
| Global Macro | Target Maturity |
| US Macro | Mixed-Assets Target Date Funds |
| YCharts Categorization | -- |
| YCharts Benchmark | -- |
| Prospectus Objective | Growth Funds |
| Fund Owner Firm Name | Voya |
| Broad Asset Class Benchmark Index | |
| ^SPXTR | 100.0% |
Net Fund Flows Versus Peer Group
1 Month
% Rank:
72
-344.81M
Peer Group Low
348.54M
Peer Group High
1 Year
% Rank:
60
-34.90M
-1.967B
Peer Group Low
2.951B
Peer Group High
3 Months
% Rank:
64
-837.69M
Peer Group Low
1.279B
Peer Group High
3 Years
% Rank:
76
-2.777B
Peer Group Low
6.572B
Peer Group High
6 Months
% Rank:
60
-1.182B
Peer Group Low
1.948B
Peer Group High
5 Years
% Rank:
79
-4.501B
Peer Group Low
11.89B
Peer Group High
YTD
% Rank:
61
-1.015B
Peer Group Low
1.576B
Peer Group High
10 Years
% Rank:
85
-9.517B
Peer Group Low
18.77B
Peer Group High
Date Unavailable
Risk
Performance Versus Peer Group
Annual Total Returns Versus Peers
As of June 10, 2026.
Asset Allocation
As of March 31, 2026.
| Type | % Net |
|---|---|
| Cash | 3.51% |
| Stock | 84.27% |
| Bond | 9.56% |
| Convertible | 0.00% |
| Preferred | 0.33% |
| Other | 2.34% |
Top 10 Holdings
| Name | % Weight | Price | % Change |
|---|---|---|---|
| Voya US Stock Index Portfolio Institutional | 33.98% | 22.82 | -0.26% |
| Voya Multi-Manager International Equity Fund I | 18.58% | 12.68 | 0.16% |
| VY T Rowe Price Capital Appreciation Port R6 | 7.45% | 27.75 | 0.33% |
| Vanguard Developed Markets Index Fund ETF | 7.04% | 69.84 | -0.03% |
| Voya Russell Large Cap Growth Index Portfolio I | 6.42% | 74.70 | -0.85% |
| Voya Multi-Manager Emerging Markets Equity Fund I | 4.99% | 16.39 | 1.24% |
| Voya Large Cap Value Fund R6 | 4.02% | 14.75 | 0.61% |
| Voya Intermediate Bond Fund R6 | 2.97% | 8.70 | 0.23% |
| Vanguard Emerging Markets Stock Index Fund ETF | 2.50% | 58.45 | 0.21% |
|
5YR T NOTE JUN26
|
2.48% | -- | -- |
Fees & Availability
| Fees | |
| Actual 12B-1 Fee | -- |
| Actual Management Fee | 0.13% |
| Administration Fee | -- |
| Maximum Front Load | -- |
| Maximum Deferred Load | -- |
| Maximum Redemption Fee | -- |
| General Availability | |
| Available for Insurance Product |
|
| Available for RRSP | No |
| Purchase Details | |
| Open to New Investors |
|
| Minimum Initial Investment | 0.00 None |
| Minimum Subsequent Investment | 0.00 None |
Basic Info
| Investment Strategy | |
| The Fund seeks to provide a combination of total return and stability of principal consistent with an asset allocation targeted to retirement. The Fund invests in a combination of underlying funds and seeks to maintain a target allocation of 90% in equity securities and 10% in fixed income securities. |
| General | |
| Security Type | Insurance Fund |
| Equity Style | -- |
| Broad Asset Class | Allocation |
| Broad Category | Allocation |
| Global Peer Group | Target Maturity MA USD 2045 |
| Peer Group | Mixed-Asset Target 2045 Funds |
| Global Macro | Target Maturity |
| US Macro | Mixed-Assets Target Date Funds |
| YCharts Categorization | -- |
| YCharts Benchmark | -- |
| Prospectus Objective | Growth Funds |
| Fund Owner Firm Name | Voya |
| Broad Asset Class Benchmark Index | |
| ^SPXTR | 100.0% |
Fundamentals
| General | |
| Distribution Yield | -- |
| Dividend Yield TTM (6-8-26) | 1.83% |
| 30-Day SEC Yield | -- |
| 7-Day SEC Yield | -- |
| Number of Holdings | 21 |
| Stock | |
| Weighted Average PE Ratio | 28.26 |
| Weighted Average Price to Sales Ratio | 6.756 |
| Weighted Average Price to Book Ratio | 8.257 |
| Weighted Median ROE | 72.12% |
| Weighted Median ROA | 13.84% |
| ROI (TTM) | 24.99% |
| Return on Investment (TTM) | 24.99% |
| Earning Yield | 0.0460 |
| LT Debt / Shareholders Equity | 0.6873 |
| Number of Equity Holdings | 0 |
| Bond | |
| Yield to Maturity (3-31-26) | 5.39% |
| Effective Duration | -- |
| Average Coupon | 4.87% |
| Calculated Average Quality | 3.391 |
| Effective Maturity | 12.38 |
| Nominal Maturity | 12.45 |
| Number of Bond Holdings | 0 |
As of March 31, 2026
Growth Metrics
| EPS Growth (1Y) | 24.48% |
| EPS Growth (3Y) | 17.30% |
| EPS Growth (5Y) | 22.15% |
| Sales Growth (1Y) | 13.71% |
| Sales Growth (3Y) | 12.64% |
| Sales Growth (5Y) | 14.56% |
| Sales per Share Growth (1Y) | 27.41% |
| Sales per Share Growth (3Y) | 13.20% |
| Operating Cash Flow - Growth Rate (3Y) | 21.92% |
As of March 31, 2026
Top Portfolio Holders
| Name | % Weight |
|---|---|
| Portfolio A | 5.00% |
| Portfolio B | 3.50% |
| Portfolio C | 2.25% |