

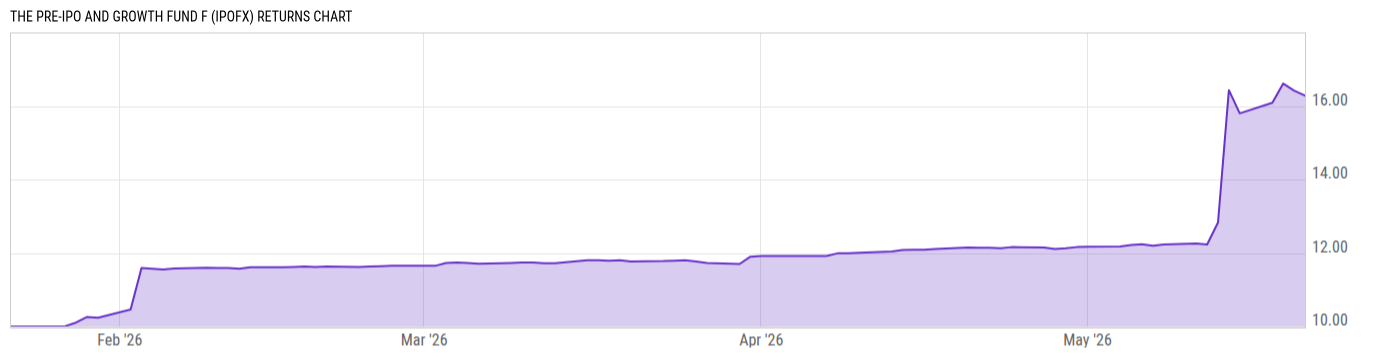
The Pre-IPO and Growth Fund F (IPOFX)
15.79
+0.14
(+0.89%)
USD |
Jun 10 2026
Returns Chart
Key Stats
| Net Expense Ratio | Total Assets Under Management | Weighted Average Dividend Yield | Turnover Ratio (Generic) |
|---|---|---|---|
| 2.85% | 123.43M | -- | -- |
| 1 Year Fund Level Flows | 1 Year Total Returns (Daily) | Annualized Total Returns Since Inception (Daily) | Max Drawdown (Since Inception) |
| -- | -- |
Basic Info
| Investment Strategy | |
| The Fund seeks long-term capital appreciation. The Fund has adopted a non-fundamental policy (the 80% Policy) to invest, under normal circumstances at least 80% of its net assets, plus the amount of borrowings for investment purposes, in Pre-IPO and Growth securities, as each of the foregoing terms that are defined. |
| General | |
| Security Type | Unlisted Closed-End Fund |
| Equity Style | -- |
| Broad Asset Class | Sector Equity |
| Broad Category | Equity |
| Global Peer Group | Equity Other |
| Peer Group | Sector Equity Funds |
| Global Macro | Equity Other |
| US Macro | -- |
| YCharts Categorization | -- |
| YCharts Benchmark | -- |
| Prospectus Objective | Sector Equity Funds |
| Fund Owner Firm Name | ABS Global Investments |
| Broad Asset Class Benchmark Index | |
| ^MSWNTR | 100.0% |
Net Fund Flows Versus Peer Group
1 Month
% Rank:
--
157.11M
Peer Group Low
157.11M
Peer Group High
1 Year
% Rank:
--
2.180B
Peer Group Low
2.180B
Peer Group High
3 Months
% Rank:
--
495.40M
Peer Group Low
495.40M
Peer Group High
3 Years
% Rank:
--
3.823B
Peer Group Low
3.823B
Peer Group High
6 Months
% Rank:
--
1.045B
Peer Group Low
1.045B
Peer Group High
5 Years
% Rank:
--
--
Peer Group Low
--
Peer Group High
YTD
% Rank:
--
616.64M
Peer Group Low
616.64M
Peer Group High
10 Years
% Rank:
--
--
Peer Group Low
--
Peer Group High
Date Unavailable
Risk
Performance Versus Peer Group
Annual Total Returns Versus Peers
As of June 11, 2026.
Asset Allocation
As of April 30, 2026.
| Type | % Net |
|---|---|
| Cash | 13.24% |
| Stock | 63.02% |
| Bond | 0.00% |
| Convertible | 0.00% |
| Preferred | 0.00% |
| Other | 23.74% |
Top 10 Holdings
| Name | % Weight | Price | % Change |
|---|---|---|---|
|
Atreides Special Circumstances Fund
|
21.76% | -- | -- |
|
UMB Bank NA
|
13.24% | -- | -- |
|
Ippe Co Invest Databricks De LP
|
7.03% | -- | -- |
|
GoAnna Capital 25R LLC
|
4.80% | -- | -- |
|
IPPE Co Invest Horizon DE LP
|
4.74% | -- | -- |
|
Ippe de Velocity LP
|
4.61% | -- | -- |
|
GoAnna Capital 25Y LLC
|
4.01% | -- | -- |
|
GoAnna Capital 25E LLC
|
3.34% | -- | -- |
|
Target Global Select Opportunities LP
|
3.23% | -- | -- |
|
GoAnna Capital 25E LLC
|
2.94% | -- | -- |
Fees & Availability
| Fees | |
| Actual 12B-1 Fee | -- |
| Actual Management Fee | 1.95% |
| Administration Fee | -- |
| Maximum Front Load | -- |
| Maximum Deferred Load | -- |
| Maximum Redemption Fee | -- |
| General Availability | |
| Available for Insurance Product | No |
| Available for RRSP | No |
| Purchase Details | |
| Open to New Investors |
|
| Minimum Initial Investment | 1.00M None |
| Minimum Subsequent Investment | 10000.00 None |
Basic Info
| Investment Strategy | |
| The Fund seeks long-term capital appreciation. The Fund has adopted a non-fundamental policy (the 80% Policy) to invest, under normal circumstances at least 80% of its net assets, plus the amount of borrowings for investment purposes, in Pre-IPO and Growth securities, as each of the foregoing terms that are defined. |
| General | |
| Security Type | Unlisted Closed-End Fund |
| Equity Style | -- |
| Broad Asset Class | Sector Equity |
| Broad Category | Equity |
| Global Peer Group | Equity Other |
| Peer Group | Sector Equity Funds |
| Global Macro | Equity Other |
| US Macro | -- |
| YCharts Categorization | -- |
| YCharts Benchmark | -- |
| Prospectus Objective | Sector Equity Funds |
| Fund Owner Firm Name | ABS Global Investments |
| Broad Asset Class Benchmark Index | |
| ^MSWNTR | 100.0% |
Fundamentals
| General | |
| Distribution Yield | -- |
| Dividend Yield TTM (6-10-26) | 0.00% |
| 30-Day SEC Yield | -- |
| 7-Day SEC Yield | -- |
| Number of Holdings | 99 |
| Stock | |
| Weighted Average PE Ratio | 39.75 |
| Weighted Average Price to Sales Ratio | 11.78 |
| Weighted Average Price to Book Ratio | 11.20 |
| Weighted Median ROE | 17.01% |
| Weighted Median ROA | 6.55% |
| ROI (TTM) | 9.96% |
| Return on Investment (TTM) | 9.96% |
| Earning Yield | 0.0297 |
| LT Debt / Shareholders Equity | 0.8029 |
| Number of Equity Holdings | 94 |
As of April 30, 2026
Growth Metrics
| EPS Growth (1Y) | 24.43% |
| EPS Growth (3Y) | 17.48% |
| EPS Growth (5Y) | 20.79% |
| Sales Growth (1Y) | 21.97% |
| Sales Growth (3Y) | 19.46% |
| Sales Growth (5Y) | 16.02% |
| Sales per Share Growth (1Y) | 23.60% |
| Sales per Share Growth (3Y) | 21.69% |
| Operating Cash Flow - Growth Rate (3Y) | 20.90% |
As of April 30, 2026
Fund Details
| Key Dates | |
| Launch Date | 1/22/2026 |
| Last Annual Report Date | -- |
| Last Prospectus Date | 1/12/2026 |
| Share Classes | |
| IPOSX | S |
| Attributes | |
| Index Fund | -- |
| Inverse Fund | No |
| Leveraged Fund | -- |
| Fund of Funds | No |
| Currency Hedged Fund | -- |
| Socially Responsible Fund | No |
Top Portfolio Holders
| Name | % Weight |
|---|---|
| Portfolio A | 5.00% |
| Portfolio B | 3.50% |
| Portfolio C | 2.25% |