

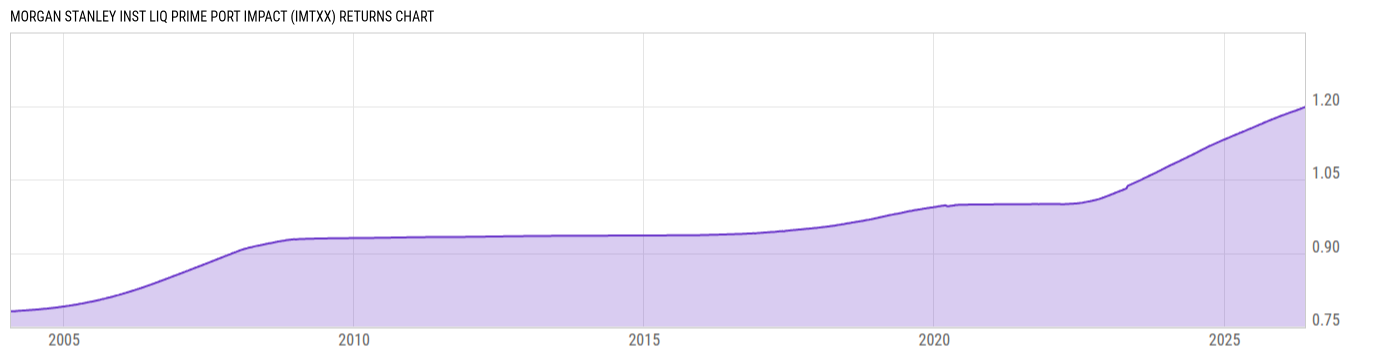
Morgan Stanley Inst Liq Prime Port Impact (IMTXX)
1.00
0.00 (0.00%)
USD |
Jun 09 2026
Returns Chart
Key Stats
| Net Expense Ratio | Total Assets Under Management | Weighted Average Dividend Yield | Turnover Ratio (Generic) |
|---|---|---|---|
| 0.20% | 14.21B | -- | -- |
| 1 Year Fund Level Flows | 1 Year Total Returns (Daily) | Annualized Total Returns Since Inception (Daily) | Max Drawdown (Since Inception) |
| 770.57M | 3.92% |
Basic Info
| Investment Strategy | |
| The Fund seeks preservation of capital, daily liquidity, and maximum current income. The Fund invests in high quality U.S. dollar-denominated money market instruments of U.S. and foreign financial and non-financial corporations. |
| General | |
| Security Type | Money Market Fund |
| Equity Style | -- |
| Broad Asset Class | Money Market |
| Broad Category | Capital Preservation |
| Global Peer Group | Money Market USD |
| Peer Group | Instl Money Market Funds |
| Global Macro | Money Market HC |
| US Macro | Taxable Money Market Funds |
| YCharts Categorization | -- |
| YCharts Benchmark | -- |
| Prospectus Objective | Instl Money Market Funds |
| Fund Owner Firm Name | Morgan Stanley |
| Broad Asset Class Benchmark Index | |
| ^BBUTB13MTR | 100.0% |
Net Fund Flows Versus Peer Group
1 Month
% Rank:
28
-1.458B
Peer Group Low
7.542B
Peer Group High
1 Year
% Rank:
47
770.57M
-462.16M
Peer Group Low
16.64B
Peer Group High
3 Months
% Rank:
71
-9.541B
Peer Group Low
11.36B
Peer Group High
3 Years
% Rank:
86
-11.37B
Peer Group Low
21.62B
Peer Group High
6 Months
% Rank:
52
-398.06M
Peer Group Low
18.74B
Peer Group High
5 Years
% Rank:
86
-12.05B
Peer Group Low
23.87B
Peer Group High
YTD
% Rank:
65
-1.153B
Peer Group Low
19.88B
Peer Group High
10 Years
% Rank:
52
-28.55B
Peer Group Low
58.37B
Peer Group High
Date Unavailable
Risk
Performance Versus Peer Group
Annual Total Returns Versus Peers
As of June 10, 2026.
Asset Allocation
As of April 30, 2026.
| Type | % Net |
|---|---|
| Cash | 95.77% |
| Stock | 0.00% |
| Bond | 4.23% |
| Convertible | 0.00% |
| Preferred | 0.00% |
| Other | 0.00% |
Top 10 Holdings
| Name | % Weight | Price | % Change |
|---|---|---|---|
|
Wells Fargo Securities LLC Repo
|
9.83% | -- | -- |
|
BNP Paribas SA Repo
|
5.46% | -- | -- |
|
Bank of Nova Scotia Repo
|
5.01% | -- | -- |
|
Credit Agricole Corporate and Investment Bank SA Repo
|
4.94% | -- | -- |
|
USD Cash
|
4.53% | -- | -- |
|
JP Morgan Securities LLC Repo
|
4.26% | -- | -- |
|
Societe Generale SA Repo
|
3.44% | -- | -- |
|
TD Securities USA LLC REPO
|
3.26% | -- | -- |
|
Mizuho Securities USA LLC Repo
|
3.20% | -- | -- |
|
Citigroup Global Markets Inc Repo
|
3.01% | -- | -- |
Fees & Availability
| Fees | |
| Actual 12B-1 Fee | -- |
| Actual Management Fee | 0.13% |
| Administration Fee | 4.59K% |
| Maximum Front Load | -- |
| Maximum Deferred Load | -- |
| Maximum Redemption Fee | -- |
| General Availability | |
| Available for Insurance Product | No |
| Available for RRSP | No |
| Purchase Details | |
| Open to New Investors |
|
| Minimum Initial Investment | 50.00M None |
| Minimum Subsequent Investment | 0.00 None |
Basic Info
| Investment Strategy | |
| The Fund seeks preservation of capital, daily liquidity, and maximum current income. The Fund invests in high quality U.S. dollar-denominated money market instruments of U.S. and foreign financial and non-financial corporations. |
| General | |
| Security Type | Money Market Fund |
| Equity Style | -- |
| Broad Asset Class | Money Market |
| Broad Category | Capital Preservation |
| Global Peer Group | Money Market USD |
| Peer Group | Instl Money Market Funds |
| Global Macro | Money Market HC |
| US Macro | Taxable Money Market Funds |
| YCharts Categorization | -- |
| YCharts Benchmark | -- |
| Prospectus Objective | Instl Money Market Funds |
| Fund Owner Firm Name | Morgan Stanley |
| Broad Asset Class Benchmark Index | |
| ^BBUTB13MTR | 100.0% |
Fundamentals
| General | |
| Distribution Yield | -- |
| Dividend Yield TTM (6-9-26) | 3.97% |
| 30-Day SEC Yield | -- |
| 7-Day SEC Yield | -- |
| Number of Holdings | 138 |
| Bond | |
| Yield to Maturity (4-30-26) | -- |
| Effective Duration | -- |
| Average Coupon | -- |
| Calculated Average Quality | -- |
| Effective Maturity | -- |
| Nominal Maturity | -- |
| Number of Bond Holdings | 31 |
As of April 30, 2026
Fund Details
| Key Dates | |
| Launch Date | 3/29/2022 |
| Last Annual Report Date | 10/31/2025 |
| Last Prospectus Date | 2/27/2026 |
| Share Classes | |
| CASXX | Other |
| IPYXX | Other |
| MAVXX | Adv |
| MPEXX | Inst |
| MPFXX | Inst |
| MPMXX | Administrator |
| MPNXX | Other |
| MPVXX | Inv |
| MSPXX | Other |
| Attributes | |
| Index Fund | -- |
| Inverse Fund | No |
| Leveraged Fund | -- |
| Fund of Funds | No |
| Currency Hedged Fund | -- |
| Socially Responsible Fund | No |
Top Portfolio Holders
| Name | % Weight |
|---|---|
| Portfolio A | 5.00% |
| Portfolio B | 3.50% |
| Portfolio C | 2.25% |