

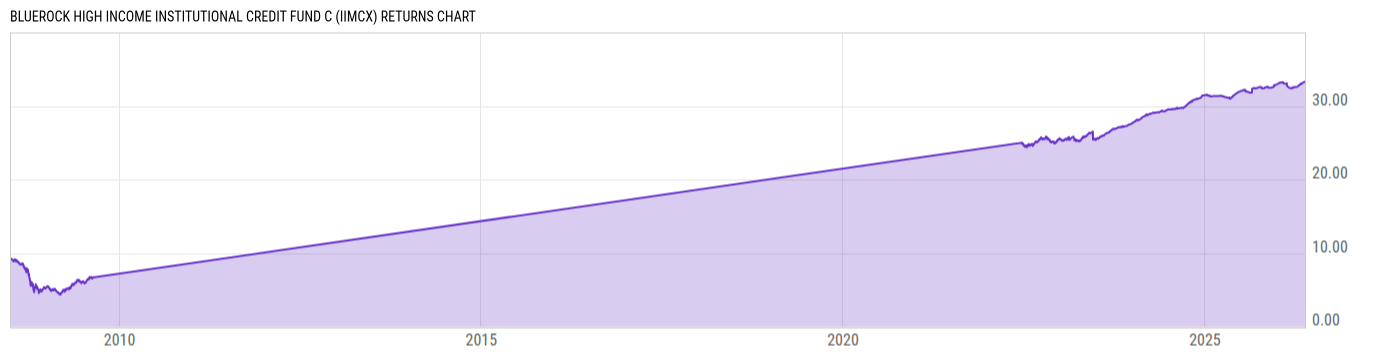
Bluerock High Income Institutional Credit Fund C (IIMCX)
22.26
-0.01
(-0.04%)
USD |
Jun 10 2026
Returns Chart
Key Stats
| Net Expense Ratio | Total Assets Under Management | Weighted Average Dividend Yield | Turnover Ratio (Generic) |
|---|---|---|---|
| 2.84% | 178.87M | -- | 68.00% |
| 1 Year Fund Level Flows | 1 Year Total Returns (Daily) | Annualized Total Returns Since Inception (Daily) | Max Drawdown (Since Inception) |
| -- | 4.43% |
Basic Info
| Investment Strategy | |
| The Fund seeks to generate high current income, while secondarily seeking attractive, long-term risk-adjusted returns, with low correlation to the broader markets. Under normal market conditions, the Fund will pursue its investment objective by investing, directly or indirectly, in senior secured loans. |
| General | |
| Security Type | Unlisted Closed-End Fund |
| Equity Style | -- |
| Broad Asset Class | Taxable Bond |
| Broad Category | Fixed Income |
| Global Peer Group | Loan Participation Funds |
| Peer Group | Loan Participation Funds |
| Global Macro | Loan Participation Funds |
| US Macro | General Domestic Taxable Fixed Income Funds |
| YCharts Categorization | -- |
| YCharts Benchmark | -- |
| Prospectus Objective | Loan Participation Funds |
| Fund Owner Firm Name | Bluerock Funds |
| Broad Asset Class Benchmark Index | |
| ^BBUSATR | 100.0% |
Net Fund Flows Versus Peer Group
1 Month
% Rank:
--
-120.38M
Peer Group Low
1.130B
Peer Group High
1 Year
% Rank:
--
-1.857B
Peer Group Low
6.524B
Peer Group High
3 Months
% Rank:
--
-902.22M
Peer Group Low
2.516B
Peer Group High
3 Years
% Rank:
--
-2.611B
Peer Group Low
21.94B
Peer Group High
6 Months
% Rank:
--
-1.596B
Peer Group Low
4.432B
Peer Group High
5 Years
% Rank:
--
-4.547B
Peer Group Low
24.56B
Peer Group High
YTD
% Rank:
--
-1.334B
Peer Group Low
3.795B
Peer Group High
10 Years
% Rank:
--
-10.87B
Peer Group Low
25.40B
Peer Group High
Date Unavailable
Risk
Performance Versus Peer Group
Annual Total Returns Versus Peers
As of June 11, 2026.
Asset Allocation
As of December 31, 2025.
| Type | % Net |
|---|---|
| Cash | 2.45% |
| Stock | 0.00% |
| Bond | 127.0% |
| Convertible | 0.00% |
| Preferred | 0.00% |
| Other | -29.41% |
Top 10 Holdings
| Name | % Weight | Price | % Change |
|---|---|---|---|
|
TRINITAS CLO LTD 10 SUB VAR 0% 16-JAN-2035
|
5.71% | -- | -- |
|
TRINITAS CLO LTD 6 SN VAR 25-JAN-2034
|
5.65% | -- | -- |
|
CTM CLO LTD 263 S1 FLT 15-APR-2039
|
4.96% | -- | -- |
|
ARINI US CLO 3 E FLT 18-JAN-2039
|
4.68% | -- | -- |
| Fidelity Instl Government Portfolio I | 3.91% | 1.00 | 0.00% |
|
TRINITAS CLO LTD 12 SUB VAR 0% 25-APR-2033
|
3.48% | -- | -- |
|
BARROW HANLEY CLO LTD 2RR ERR SEQ FLT 9.28444% 31-MAR-2038
|
3.23% | -- | -- |
|
WELLFLEET CLO LIMITED 221R D1R FLT 7.62219% 15-JUL-2037
|
2.79% | -- | -- |
|
ZAIS CLO LIMITED 18R DJR FIX 9% 26-OCT-2037
|
2.76% | -- | -- |
|
GOLDENTREE LOAN MANAGEMENT US CLO LTD 24 F FLT 10.66763% 20-OCT-2038
|
2.72% | -- | -- |
Fees & Availability
| Fees | |
| Actual 12B-1 Fee | 0.75% |
| Actual Management Fee | 0.59% |
| Administration Fee | 25.10K% |
| Maximum Front Load | -- |
| Maximum Deferred Load | -- |
| Maximum Redemption Fee | -- |
| General Availability | |
| Available for Insurance Product | No |
| Available for RRSP | No |
| Purchase Details | |
| Open to New Investors |
|
| Minimum Initial Investment | 2500.00 None |
| Minimum Subsequent Investment | 100.00 None |
Basic Info
| Investment Strategy | |
| The Fund seeks to generate high current income, while secondarily seeking attractive, long-term risk-adjusted returns, with low correlation to the broader markets. Under normal market conditions, the Fund will pursue its investment objective by investing, directly or indirectly, in senior secured loans. |
| General | |
| Security Type | Unlisted Closed-End Fund |
| Equity Style | -- |
| Broad Asset Class | Taxable Bond |
| Broad Category | Fixed Income |
| Global Peer Group | Loan Participation Funds |
| Peer Group | Loan Participation Funds |
| Global Macro | Loan Participation Funds |
| US Macro | General Domestic Taxable Fixed Income Funds |
| YCharts Categorization | -- |
| YCharts Benchmark | -- |
| Prospectus Objective | Loan Participation Funds |
| Fund Owner Firm Name | Bluerock Funds |
| Broad Asset Class Benchmark Index | |
| ^BBUSATR | 100.0% |
Fundamentals
| General | |
| Distribution Yield | -- |
| Dividend Yield TTM (6-10-26) | 8.41% |
| 30-Day SEC Yield | -- |
| 7-Day SEC Yield | -- |
| Number of Holdings | 121 |
| Bond | |
| Yield to Maturity (12-31-25) | 9.29% |
| Effective Duration | -- |
| Average Coupon | 10.54% |
| Calculated Average Quality | 5.118 |
| Effective Maturity | 11.12 |
| Nominal Maturity | 11.12 |
| Number of Bond Holdings | 117 |
As of December 31, 2025
Fund Details
Top Portfolio Holders
| Name | % Weight |
|---|---|
| Portfolio A | 5.00% |
| Portfolio B | 3.50% |
| Portfolio C | 2.25% |