

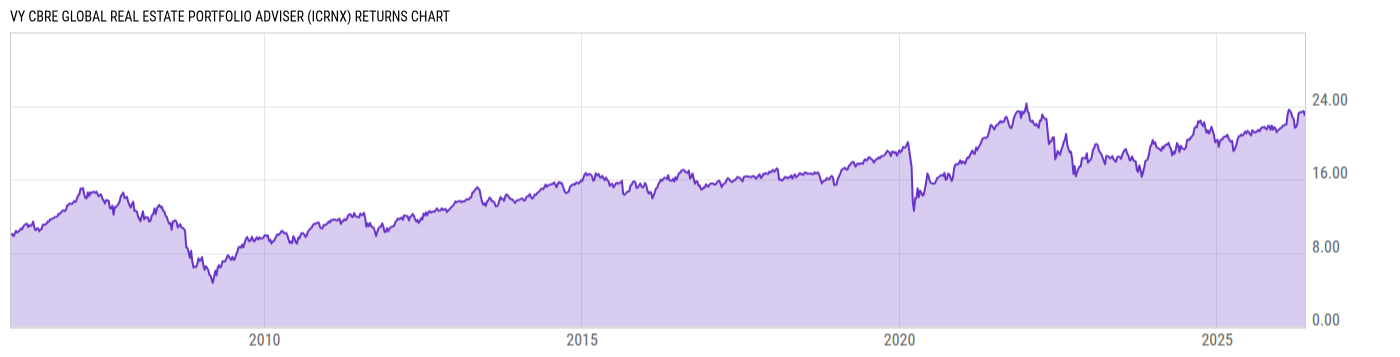
VY CBRE Global Real Estate Portfolio Adviser (ICRNX)
10.43
+0.19
(+1.86%)
USD |
Jun 09 2026
Returns Chart
Key Stats
| Net Expense Ratio | Total Assets Under Management | Weighted Average Dividend Yield | Turnover Ratio (Generic) |
|---|---|---|---|
| 1.51% | 108.98M | 3.33% | 101.0% |
| 1 Year Fund Level Flows | 1 Year Total Returns (Daily) | Annualized Total Returns Since Inception (Daily) | Max Drawdown (Since Inception) |
| -46.12M | 9.63% |
Basic Info
| Investment Strategy | |
| The Fund seeks to provide investors with high total return. The Fund will invest at least 80% of its assets in a portfolio of equity securities of companies that are principally engaged in the real estate industry. The investments will be in a number of different countries located throughout the world, including the U.S. |
| General | |
| Security Type | Insurance Fund |
| Equity Style | Multi Cap Value |
| Broad Asset Class | Sector Equity |
| Broad Category | Equity |
| Global Peer Group | Equity Sector Real Estate Global |
| Peer Group | Global Real Estate Funds |
| Global Macro | Equity Real Estate |
| US Macro | World Sector Equity Funds |
| YCharts Categorization | -- |
| YCharts Benchmark | -- |
| Prospectus Objective | Global Real Estate Funds |
| Fund Owner Firm Name | Voya |
| Broad Asset Class Benchmark Index | |
| ^MSWNTR | 100.0% |
Net Fund Flows Versus Peer Group
1 Month
% Rank:
73
-51.84M
Peer Group Low
172.90M
Peer Group High
1 Year
% Rank:
71
-46.12M
-318.79M
Peer Group Low
2.126B
Peer Group High
3 Months
% Rank:
75
-235.65M
Peer Group Low
2.126B
Peer Group High
3 Years
% Rank:
59
-2.467B
Peer Group Low
2.461B
Peer Group High
6 Months
% Rank:
71
-202.45M
Peer Group Low
2.126B
Peer Group High
5 Years
% Rank:
50
-2.920B
Peer Group Low
2.958B
Peer Group High
YTD
% Rank:
76
-183.58M
Peer Group Low
2.126B
Peer Group High
10 Years
% Rank:
59
-3.011B
Peer Group Low
3.342B
Peer Group High
Date Unavailable
Risk
Performance Versus Peer Group
Annual Total Returns Versus Peers
As of June 10, 2026.
Asset Allocation
As of April 30, 2026.
| Type | % Net |
|---|---|
| Cash | 0.39% |
| Stock | 99.36% |
| Bond | 0.26% |
| Convertible | 0.00% |
| Preferred | 0.00% |
| Other | 0.00% |
Top 10 Holdings
| Name | % Weight | Price | % Change |
|---|---|---|---|
| Welltower, Inc. | 9.65% | 206.77 | 3.38% |
| Equinix, Inc. | 7.00% | 1059.84 | -0.27% |
| Prologis, Inc. | 5.26% | 147.52 | 3.32% |
| Simon Property Group, Inc. | 4.57% | 211.89 | 2.19% |
| Iron Mountain, Inc. | 2.96% | 126.14 | 2.14% |
| Ventas, Inc. | 2.69% | 82.47 | 3.58% |
| Goodman Group | 2.52% | 21.88 | 3.94% |
| VICI Properties, Inc. | 2.49% | 28.02 | 2.26% |
| Realty Income Corp. | 2.40% | 61.25 | 2.07% |
| Mitsui Fudosan Co., Ltd. | 2.38% | 8.70 | 0.00% |
Fees & Availability
| Fees | |
| Actual 12B-1 Fee | 0.60% |
| Actual Management Fee | 0.69% |
| Administration Fee | -- |
| Maximum Front Load | -- |
| Maximum Deferred Load | -- |
| Maximum Redemption Fee | -- |
| General Availability | |
| Available for Insurance Product |
|
| Available for RRSP | No |
| Purchase Details | |
| Open to New Investors |
|
| Minimum Initial Investment | 0.00 None |
| Minimum Subsequent Investment | 0.00 None |
Basic Info
| Investment Strategy | |
| The Fund seeks to provide investors with high total return. The Fund will invest at least 80% of its assets in a portfolio of equity securities of companies that are principally engaged in the real estate industry. The investments will be in a number of different countries located throughout the world, including the U.S. |
| General | |
| Security Type | Insurance Fund |
| Equity Style | Multi Cap Value |
| Broad Asset Class | Sector Equity |
| Broad Category | Equity |
| Global Peer Group | Equity Sector Real Estate Global |
| Peer Group | Global Real Estate Funds |
| Global Macro | Equity Real Estate |
| US Macro | World Sector Equity Funds |
| YCharts Categorization | -- |
| YCharts Benchmark | -- |
| Prospectus Objective | Global Real Estate Funds |
| Fund Owner Firm Name | Voya |
| Broad Asset Class Benchmark Index | |
| ^MSWNTR | 100.0% |
Fundamentals
| General | |
| Distribution Yield | -- |
| Dividend Yield TTM (6-8-26) | 5.22% |
| 30-Day SEC Yield (5-31-26) | 1.91% |
| 7-Day SEC Yield (1-31-20) | 1.56% |
| Number of Holdings | 82 |
| Stock | |
| Weighted Average PE Ratio | 29.77 |
| Weighted Average Price to Sales Ratio | 9.763 |
| Weighted Average Price to Book Ratio | 3.036 |
| Weighted Median ROE | 12.06% |
| Weighted Median ROA | 3.97% |
| ROI (TTM) | 10.63% |
| Return on Investment (TTM) | 10.63% |
| Earning Yield | 0.0476 |
| LT Debt / Shareholders Equity | 0.9052 |
| Number of Equity Holdings | 79 |
As of April 30, 2026
Growth Metrics
| EPS Growth (1Y) | 22.07% |
| EPS Growth (3Y) | 12.58% |
| EPS Growth (5Y) | 6.44% |
| Sales Growth (1Y) | 10.61% |
| Sales Growth (3Y) | 9.73% |
| Sales Growth (5Y) | 10.84% |
| Sales per Share Growth (1Y) | 5.71% |
| Sales per Share Growth (3Y) | 5.01% |
| Operating Cash Flow - Growth Rate (3Y) | 10.98% |
As of April 30, 2026
Fund Details
Top Portfolio Holders
| Name | % Weight |
|---|---|
| Portfolio A | 5.00% |
| Portfolio B | 3.50% |
| Portfolio C | 2.25% |