

Voya Inflation Protected Bond Plus Port Inst (IBRIX)
9.26
+0.02
(+0.22%)
USD |
Jun 09 2026
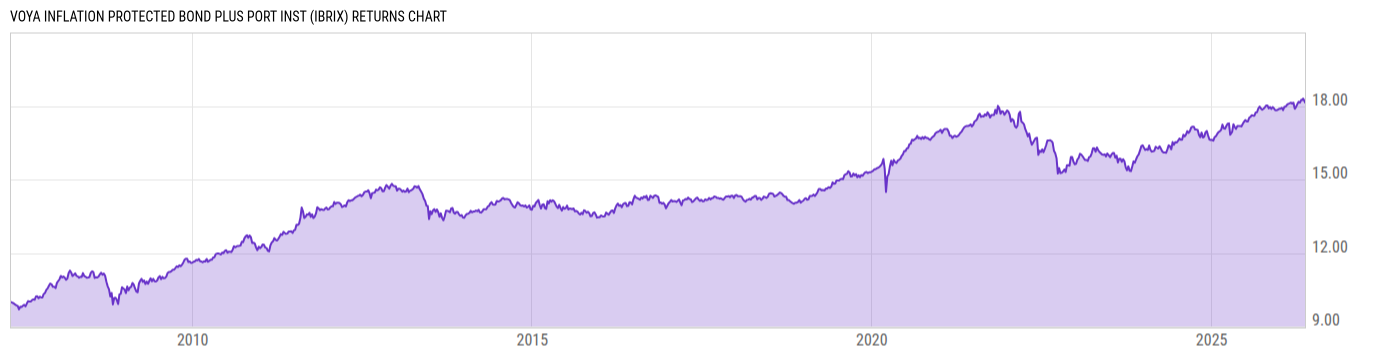
Returns Chart
Key Stats
| Net Expense Ratio | Total Assets Under Management | Weighted Average Dividend Yield | Turnover Ratio (Generic) |
|---|---|---|---|
| 0.59% | 145.12M | -- | 80.00% |
| 1 Year Fund Level Flows | 1 Year Total Returns (Daily) | Annualized Total Returns Since Inception (Daily) | Max Drawdown (Since Inception) |
| 16.51M | 6.05% |
Basic Info
| Investment Strategy | |
| The Fund seeks maximum real return, consistent with real capital and prudent investment management. Under normal circumstances, the Portfolio invests at least 80% of its net asstes (plus the amount of any borrowings for investment purposes) in inflation-indexed bonds and other bonds and debt obligations of any kind. |
| General | |
| Security Type | Insurance Fund |
| Equity Style | -- |
| Broad Asset Class | Taxable Bond |
| Broad Category | Fixed Income |
| Global Peer Group | Bond USD Inflation Linked |
| Peer Group | Inflation Protected Bond Funds |
| Global Macro | Bond HC |
| US Macro | Short-/Intermediate-Term U.S. Government & Treasury Funds |
| YCharts Categorization | -- |
| YCharts Benchmark | -- |
| Prospectus Objective | Inflation Protected Bond Funds |
| Fund Owner Firm Name | Voya |
| Broad Asset Class Benchmark Index | |
| ^BBUSATR | 100.0% |
Net Fund Flows Versus Peer Group
1 Month
% Rank:
68
-80.30M
Peer Group Low
1.937B
Peer Group High
1 Year
% Rank:
37
16.51M
-839.78M
Peer Group Low
9.912B
Peer Group High
3 Months
% Rank:
58
-968.21M
Peer Group Low
4.610B
Peer Group High
3 Years
% Rank:
34
-8.412B
Peer Group Low
17.47B
Peer Group High
6 Months
% Rank:
25
-1.074B
Peer Group Low
5.312B
Peer Group High
5 Years
% Rank:
46
-12.69B
Peer Group Low
17.47B
Peer Group High
YTD
% Rank:
31
-1.270B
Peer Group Low
4.299B
Peer Group High
10 Years
% Rank:
73
-6.738B
Peer Group Low
45.84B
Peer Group High
Date Unavailable
Risk
Performance Versus Peer Group
Annual Total Returns Versus Peers
As of June 10, 2026.
Asset Allocation
As of April 30, 2026.
| Type | % Net |
|---|---|
| Cash | 5.66% |
| Stock | 0.00% |
| Bond | 93.99% |
| Convertible | 0.00% |
| Preferred | 0.00% |
| Other | 0.35% |
Top 10 Holdings
| Name | % Weight | Price | % Change |
|---|---|---|---|
|
Future General Security
|
38.37% | -- | -- |
|
FEDERAL HOME LOAN MORTGAGE CORPORATION 5410J DF PT FLT 5.1119% 25-MAY-2054
|
3.35% | -- | -- |
| AutoZone, Inc. AZO 05/01/2026 FIX USD Corporate (Matured) | 1.38% | 99.99 | 0.01% |
| BASF SE BASFSE 0.0 06/29/2026 FIX USD Corporate | 1.37% | 99.78 | 0.01% |
|
United States of America (Government) 3.75% 30-APR-2028
|
1.30% | -- | -- |
|
ZAXBYS FUNDING LLC 211 A2 FIX 3.238% 31-JUL-2051
|
1.25% | -- | -- |
|
SABAL ISSUER LLC 261 A1 FIX 6% 02-MAY-2061
|
1.19% | -- | -- |
|
FEDERAL HOME LOAN MORTGAGE CORPORATION 5472A FE PT FLT 5.0119% 25-NOV-2054
|
1.14% | -- | -- |
|
FEDERAL HOME LOAN MORTGAGE CORPORATION 5460N FH PT FLT 4.7619% 25-OCT-2054
|
1.11% | -- | -- |
|
PAGAYA AI DEBT GRANTOR TRUST 254 B FIX 5.688% 18-JAN-2033
|
1.07% | -- | -- |
Fees & Availability
| Fees | |
| Actual 12B-1 Fee | -- |
| Actual Management Fee | 0.48% |
| Administration Fee | -- |
| Maximum Front Load | -- |
| Maximum Deferred Load | -- |
| Maximum Redemption Fee | -- |
| General Availability | |
| Available for Insurance Product |
|
| Available for RRSP | No |
| Purchase Details | |
| Open to New Investors |
|
| Minimum Initial Investment | 0.00 None |
| Minimum Subsequent Investment | 0.00 None |
Basic Info
| Investment Strategy | |
| The Fund seeks maximum real return, consistent with real capital and prudent investment management. Under normal circumstances, the Portfolio invests at least 80% of its net asstes (plus the amount of any borrowings for investment purposes) in inflation-indexed bonds and other bonds and debt obligations of any kind. |
| General | |
| Security Type | Insurance Fund |
| Equity Style | -- |
| Broad Asset Class | Taxable Bond |
| Broad Category | Fixed Income |
| Global Peer Group | Bond USD Inflation Linked |
| Peer Group | Inflation Protected Bond Funds |
| Global Macro | Bond HC |
| US Macro | Short-/Intermediate-Term U.S. Government & Treasury Funds |
| YCharts Categorization | -- |
| YCharts Benchmark | -- |
| Prospectus Objective | Inflation Protected Bond Funds |
| Fund Owner Firm Name | Voya |
| Broad Asset Class Benchmark Index | |
| ^BBUSATR | 100.0% |
Fundamentals
| General | |
| Distribution Yield | -- |
| Dividend Yield TTM (6-8-26) | 4.60% |
| 30-Day SEC Yield (5-31-26) | 5.89% |
| 7-Day SEC Yield | -- |
| Number of Holdings | 351 |
| Bond | |
| Yield to Maturity (4-30-26) | 4.05% |
| Effective Duration | -- |
| Average Coupon | 4.38% |
| Calculated Average Quality | 2.458 |
| Effective Maturity | 15.13 |
| Nominal Maturity | 15.21 |
| Number of Bond Holdings | 323 |
As of April 30, 2026
Fund Details
| Key Dates | |
| Launch Date | 4/30/2007 |
| Last Annual Report Date | 12/31/2025 |
| Last Prospectus Date | 5/1/2026 |
| Share Classes | |
| IBRAX | Adv |
| Attributes | |
| Index Fund | -- |
| Inverse Fund | No |
| Leveraged Fund | -- |
| Fund of Funds | No |
| Currency Hedged Fund | -- |
| Socially Responsible Fund | No |
Top Portfolio Holders
| Name | % Weight |
|---|---|
| Portfolio A | 5.00% |
| Portfolio B | 3.50% |
| Portfolio C | 2.25% |