

JPMorgan Liquid Assets Money Market Fund Reserve (HPIXX)
1.00
0.00 (0.00%)
USD |
Jun 09 2026
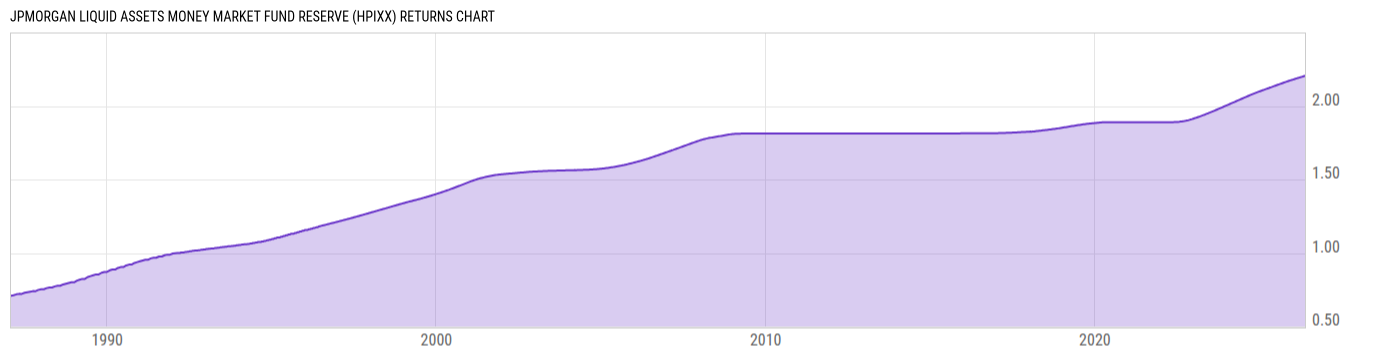
Returns Chart
Key Stats
| Net Expense Ratio | Total Assets Under Management | Weighted Average Dividend Yield | Turnover Ratio (Generic) |
|---|---|---|---|
| 0.69% | 83.49B | -- | -- |
| 1 Year Fund Level Flows | 1 Year Total Returns (Daily) | Annualized Total Returns Since Inception (Daily) | Max Drawdown (Since Inception) |
| 1.592B | 3.40% |
Basic Info
| Investment Strategy | |
| The Fund seeks current income with liquidity and stability of principal. The Fund invests in high quality, short-term money market instruments which are issued and payable in U.S. dollars. The Fund seeks to maintain a net asset value of $1.00 per share and a dollar-weighted average maturity of 60 days or less. |
| General | |
| Security Type | Money Market Fund |
| Equity Style | -- |
| Broad Asset Class | Money Market |
| Broad Category | Capital Preservation |
| Global Peer Group | Money Market USD |
| Peer Group | Money Market Funds |
| Global Macro | Money Market HC |
| US Macro | Taxable Money Market Funds |
| YCharts Categorization | -- |
| YCharts Benchmark | -- |
| Prospectus Objective | Money Market Funds |
| Fund Owner Firm Name | J.P. Morgan Asset Management |
| Broad Asset Class Benchmark Index | |
| ^BBUTB13MTR | 100.0% |
Net Fund Flows Versus Peer Group
1 Month
% Rank:
7
-461.26M
Peer Group Low
1.539B
Peer Group High
1 Year
% Rank:
28
1.592B
-8.251B
Peer Group Low
14.16B
Peer Group High
3 Months
% Rank:
88
-4.836B
Peer Group Low
83.19M
Peer Group High
3 Years
% Rank:
26
-1.574B
Peer Group Low
154.90B
Peer Group High
6 Months
% Rank:
73
-5.502B
Peer Group Low
149.91M
Peer Group High
5 Years
% Rank:
26
-2.118B
Peer Group Low
271.50B
Peer Group High
YTD
% Rank:
68
-6.442B
Peer Group Low
80.60M
Peer Group High
10 Years
% Rank:
26
-39.66B
Peer Group Low
336.94B
Peer Group High
Date Unavailable
Risk
Performance Versus Peer Group
Annual Total Returns Versus Peers
As of June 10, 2026.
Asset Allocation
As of March 31, 2026.
| Type | % Net |
|---|---|
| Cash | 91.60% |
| Stock | 0.00% |
| Bond | 8.55% |
| Convertible | 0.00% |
| Preferred | 0.00% |
| Other | -0.15% |
Top 10 Holdings
| Name | % Weight | Price | % Change |
|---|---|---|---|
|
Fixed Income Clearing Corp Repo
|
7.32% | -- | -- |
|
Cash and Cash Equivalents
|
2.48% | -- | -- |
|
Mizuho Bank Ltd (New York Branch) Time/Term Deposit
|
2.40% | -- | -- |
|
Bank of America NA Repo
|
2.40% | -- | -- |
|
ABN Amro NV Time/Term Deposit
|
2.34% | -- | -- |
|
BNP Paribas SA Repo
|
2.06% | -- | -- |
|
Societe Generale SA Repo
|
2.06% | -- | -- |
|
Skandinaviska Enskilda Banken AB New York Time/Term Deposit
|
1.82% | -- | -- |
| Landesbank Baden-Wurttemberg, New York NDES5393 04/01/2026 FIX USD Corporate (Matured) | 1.65% | -- | -- |
|
Natixis Securities Americas LLC Repo
|
1.65% | -- | -- |
Fees & Availability
| Fees | |
| Actual 12B-1 Fee | 0.25% |
| Actual Management Fee | 0.08% |
| Administration Fee | 5.14K% |
| Maximum Front Load | -- |
| Maximum Deferred Load | -- |
| Maximum Redemption Fee | -- |
| General Availability | |
| Available for Insurance Product | -- |
| Available for RRSP | -- |
| Purchase Details | |
| Open to New Investors |
|
| Minimum Initial Investment | 10.00M None |
| Minimum Subsequent Investment | 0.00 None |
Basic Info
| Investment Strategy | |
| The Fund seeks current income with liquidity and stability of principal. The Fund invests in high quality, short-term money market instruments which are issued and payable in U.S. dollars. The Fund seeks to maintain a net asset value of $1.00 per share and a dollar-weighted average maturity of 60 days or less. |
| General | |
| Security Type | Money Market Fund |
| Equity Style | -- |
| Broad Asset Class | Money Market |
| Broad Category | Capital Preservation |
| Global Peer Group | Money Market USD |
| Peer Group | Money Market Funds |
| Global Macro | Money Market HC |
| US Macro | Taxable Money Market Funds |
| YCharts Categorization | -- |
| YCharts Benchmark | -- |
| Prospectus Objective | Money Market Funds |
| Fund Owner Firm Name | J.P. Morgan Asset Management |
| Broad Asset Class Benchmark Index | |
| ^BBUTB13MTR | 100.0% |
Fundamentals
| General | |
| Distribution Yield | -- |
| Dividend Yield TTM (6-9-26) | 3.44% |
| 30-Day SEC Yield | -- |
| 7-Day SEC Yield (4-30-26) | 3.23% |
| Number of Holdings | 422 |
| Bond | |
| Yield to Maturity (3-31-26) | -- |
| Effective Duration | -- |
| Average Coupon | -- |
| Calculated Average Quality | -- |
| Effective Maturity | -- |
| Nominal Maturity | -- |
| Number of Bond Holdings | 23 |
As of March 31, 2026
Fund Details
| Key Dates | |
| Launch Date | 2/18/1992 |
| Last Annual Report Date | 2/28/2026 |
| Last Prospectus Date | 7/1/2025 |
| Share Classes | |
| AJLXX | Other |
| CJLXX | Other |
| HLPXX | Inv |
| IJLXX | Inst |
| MJLXX | Other |
| PJLXX | Premier |
| Attributes | |
| Index Fund | -- |
| Inverse Fund | -- |
| Leveraged Fund | -- |
| Fund of Funds | No |
| Currency Hedged Fund | -- |
| Socially Responsible Fund | No |
Top Portfolio Holders
| Name | % Weight |
|---|---|
| Portfolio A | 5.00% |
| Portfolio B | 3.50% |
| Portfolio C | 2.25% |