

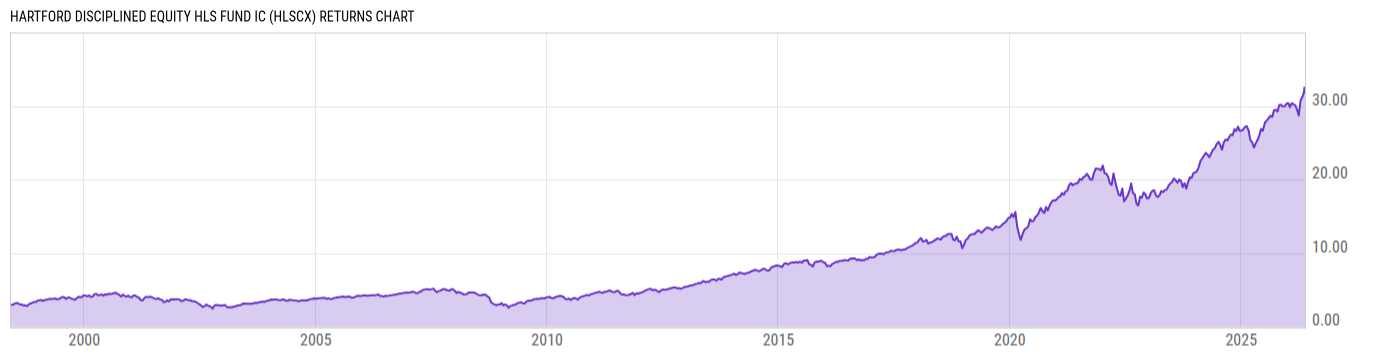
Hartford Disciplined Equity HLS Fund IC (HLSCX)
24.39
-0.04
(-0.16%)
USD |
Jun 09 2026
Returns Chart
Key Stats
| Net Expense Ratio | Total Assets Under Management | Weighted Average Dividend Yield | Turnover Ratio (Generic) |
|---|---|---|---|
| 1.10% | 3.008B | 0.91% | 35.00% |
| 1 Year Fund Level Flows | 1 Year Total Returns (Daily) | Annualized Total Returns Since Inception (Daily) | Max Drawdown (Since Inception) |
| -381.56M | 17.91% |
Basic Info
| Investment Strategy | |
| The Fund seeks growth of capital. Under normal circumstances, the Fund invests at least 80% of its assets in common stocks. The Fund's portfolio is broadly diversified by industry and company. The Fund may invest in a broad range of market capitalizations, but tends to focus on large capitalization companies. |
| General | |
| Security Type | Insurance Fund |
| Equity Style | Large Cap Core |
| Broad Asset Class | US Equity |
| Broad Category | Equity |
| Global Peer Group | Equity US |
| Peer Group | Large-Cap Core Funds |
| Global Macro | Equity North America |
| US Macro | Large-Cap Funds |
| YCharts Categorization | -- |
| YCharts Benchmark | -- |
| Prospectus Objective | Growth & Income Funds |
| Fund Owner Firm Name | Hartford Funds |
| Broad Asset Class Benchmark Index | |
| ^SPXTR | 100.0% |
Net Fund Flows Versus Peer Group
1 Month
% Rank:
73
-5.000B
Peer Group Low
1.389B
Peer Group High
1 Year
% Rank:
74
-381.56M
-17.51B
Peer Group Low
12.02B
Peer Group High
3 Months
% Rank:
75
-10.05B
Peer Group Low
6.098B
Peer Group High
3 Years
% Rank:
76
-31.24B
Peer Group Low
27.22B
Peer Group High
6 Months
% Rank:
74
-13.55B
Peer Group Low
6.098B
Peer Group High
5 Years
% Rank:
78
-56.24B
Peer Group Low
27.17B
Peer Group High
YTD
% Rank:
76
-12.29B
Peer Group Low
6.098B
Peer Group High
10 Years
% Rank:
79
-137.74B
Peer Group Low
27.24B
Peer Group High
Date Unavailable
Risk
Performance Versus Peer Group
Annual Total Returns Versus Peers
As of June 10, 2026.
Asset Allocation
As of April 30, 2026.
| Type | % Net |
|---|---|
| Cash | 0.14% |
| Stock | 99.39% |
| Bond | 0.00% |
| Convertible | 0.00% |
| Preferred | 0.03% |
| Other | 0.45% |
Top 10 Holdings
| Name | % Weight | Price | % Change |
|---|---|---|---|
| NVIDIA Corp. | 8.52% | 208.19 | -0.22% |
| Alphabet, Inc. | 7.55% | 364.26 | 0.26% |
| Apple, Inc. | 6.65% | 290.55 | -3.64% |
| Microsoft Corp. | 5.78% | 403.41 | -2.02% |
| Amazon.com, Inc. | 5.21% | 244.19 | -0.42% |
| Broadcom Inc. | 4.28% | 392.16 | -1.12% |
| Meta Platforms, Inc. | 2.70% | 584.59 | -0.14% |
| Eli Lilly & Co. | 2.10% | 1144.68 | -0.39% |
| JPMorgan Chase & Co. | 2.09% | 312.70 | 0.51% |
| Mastercard, Inc. | 1.77% | 495.24 | 1.97% |
Fees & Availability
| Fees | |
| Actual 12B-1 Fee | 0.25% |
| Actual Management Fee | 0.57% |
| Administration Fee | -- |
| Maximum Front Load | -- |
| Maximum Deferred Load | -- |
| Maximum Redemption Fee | -- |
| General Availability | |
| Available for Insurance Product |
|
| Available for RRSP | No |
| Purchase Details | |
| Open to New Investors |
|
| Minimum Initial Investment | 0.00 None |
| Minimum Subsequent Investment | 0.00 None |
Basic Info
| Investment Strategy | |
| The Fund seeks growth of capital. Under normal circumstances, the Fund invests at least 80% of its assets in common stocks. The Fund's portfolio is broadly diversified by industry and company. The Fund may invest in a broad range of market capitalizations, but tends to focus on large capitalization companies. |
| General | |
| Security Type | Insurance Fund |
| Equity Style | Large Cap Core |
| Broad Asset Class | US Equity |
| Broad Category | Equity |
| Global Peer Group | Equity US |
| Peer Group | Large-Cap Core Funds |
| Global Macro | Equity North America |
| US Macro | Large-Cap Funds |
| YCharts Categorization | -- |
| YCharts Benchmark | -- |
| Prospectus Objective | Growth & Income Funds |
| Fund Owner Firm Name | Hartford Funds |
| Broad Asset Class Benchmark Index | |
| ^SPXTR | 100.0% |
Fundamentals
| General | |
| Distribution Yield | -- |
| Dividend Yield TTM (6-8-26) | 0.04% |
| 30-Day SEC Yield (5-31-21) | 0.00% |
| 7-Day SEC Yield | -- |
| Number of Holdings | 80 |
| Stock | |
| Weighted Average PE Ratio | 32.44 |
| Weighted Average Price to Sales Ratio | 9.787 |
| Weighted Average Price to Book Ratio | 12.45 |
| Weighted Median ROE | 165.3% |
| Weighted Median ROA | 20.23% |
| ROI (TTM) | 28.39% |
| Return on Investment (TTM) | 28.39% |
| Earning Yield | 0.0351 |
| LT Debt / Shareholders Equity | 0.8301 |
| Number of Equity Holdings | 78 |
As of April 30, 2026
Growth Metrics
| EPS Growth (1Y) | 32.57% |
| EPS Growth (3Y) | 26.32% |
| EPS Growth (5Y) | 28.00% |
| Sales Growth (1Y) | 16.97% |
| Sales Growth (3Y) | 18.03% |
| Sales Growth (5Y) | 16.76% |
| Sales per Share Growth (1Y) | 17.79% |
| Sales per Share Growth (3Y) | 18.37% |
| Operating Cash Flow - Growth Rate (3Y) | 28.88% |
As of April 30, 2026
Fund Details
| Key Dates | |
| Launch Date | 9/18/2020 |
| Last Annual Report Date | 12/31/2025 |
| Last Prospectus Date | 4/30/2026 |
| Share Classes | |
| HBGIX | Other |
| HIAGX | Other |
| LP40090271 | Other |
| LP40090272 | Other |
| Attributes | |
| Index Fund | -- |
| Inverse Fund | No |
| Leveraged Fund | -- |
| Fund of Funds | No |
| Currency Hedged Fund | -- |
| Socially Responsible Fund | No |
Top Portfolio Holders
| Name | % Weight |
|---|---|
| Portfolio A | 5.00% |
| Portfolio B | 3.50% |
| Portfolio C | 2.25% |