

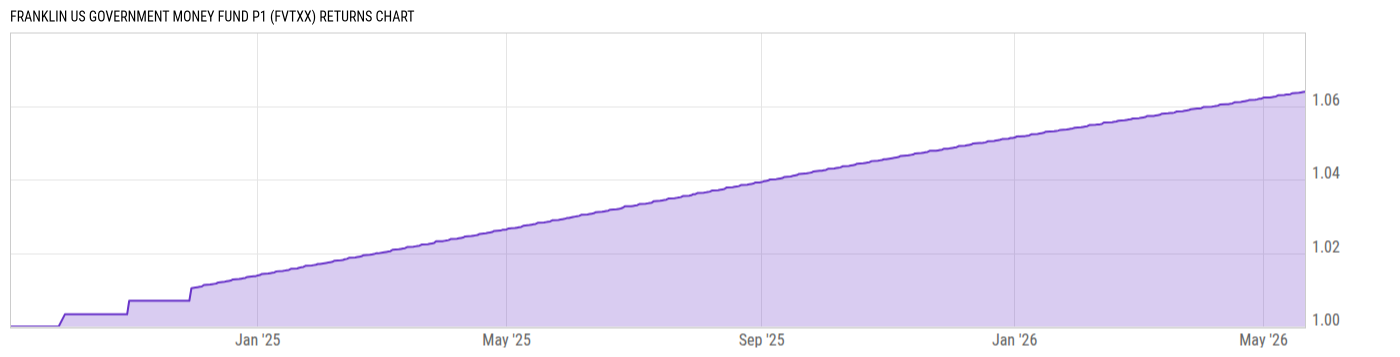
Franklin US Government Money Fund P1 (FVTXX)
1.00
0.00 (0.00%)
USD |
Jun 09 2026
Returns Chart
Key Stats
| Net Expense Ratio | Total Assets Under Management | Weighted Average Dividend Yield | Turnover Ratio (Generic) |
|---|---|---|---|
| 0.59% | 11.17B | -- | -- |
| 1 Year Fund Level Flows | 1 Year Total Returns (Daily) | Annualized Total Returns Since Inception (Daily) | Max Drawdown (Since Inception) |
| 1.217B | 3.32% |
Basic Info
| Investment Strategy | |
| The Fund seeks to provide investors with as high a level of current income as is consistent with the preservation of shareholder's capital and liquidity. The Fund also tries to maintain a stable $1 share price. The Fund invests mainly in high-quality, short-term U.S. dollar-denominated money market securities. |
| General | |
| Security Type | Money Market Fund |
| Equity Style | -- |
| Broad Asset Class | Money Market |
| Broad Category | Capital Preservation |
| Global Peer Group | Money Market USD |
| Peer Group | U.S. Government Money Market Funds |
| Global Macro | Money Market HC |
| US Macro | Taxable Money Market Funds |
| YCharts Categorization | -- |
| YCharts Benchmark | -- |
| Prospectus Objective | U.S. Government Money Market Funds |
| Fund Owner Firm Name | Franklin Templeton |
| Broad Asset Class Benchmark Index | |
| ^BBUTB13MTR | 100.0% |
Net Fund Flows Versus Peer Group
1 Month
% Rank:
19
-3.984B
Peer Group Low
5.094B
Peer Group High
1 Year
% Rank:
13
1.217B
-5.811B
Peer Group Low
44.03B
Peer Group High
3 Months
% Rank:
9
-6.010B
Peer Group Low
13.98B
Peer Group High
3 Years
% Rank:
97
-3.385B
Peer Group Low
149.96B
Peer Group High
6 Months
% Rank:
14
-13.14B
Peer Group Low
18.91B
Peer Group High
5 Years
% Rank:
94
-37.54B
Peer Group Low
190.74B
Peer Group High
YTD
% Rank:
7
-9.925B
Peer Group Low
8.301B
Peer Group High
10 Years
% Rank:
100
-14.28B
Peer Group Low
341.23B
Peer Group High
Date Unavailable
Risk
Performance Versus Peer Group
Annual Total Returns Versus Peers
As of June 10, 2026.
Asset Allocation
As of April 30, 2026.
| Type | % Net |
|---|---|
| Cash | -0.00% |
| Stock | 0.00% |
| Bond | 0.00% |
| Convertible | 0.00% |
| Preferred | 0.00% |
| Other | 100.0% |
Top 3 Holdings
| Name | % Weight | Price | % Change |
|---|---|---|---|
|
US GOVERNMENT MONEY MARKET PORTFOLIO
|
100.0% | -- | -- |
|
USD CASH
|
-0.00% | -- | -- |
|
OTHER ASSETS LESS LIABILITIES
|
-0.04% | -- | -- |
Fees & Availability
| Fees | |
| Actual 12B-1 Fee | 0.10% |
| Actual Management Fee | 0.15% |
| Administration Fee | 26.65K% |
| Maximum Front Load | -- |
| Maximum Deferred Load | -- |
| Maximum Redemption Fee | -- |
| General Availability | |
| Available for Insurance Product | No |
| Available for RRSP | No |
| Purchase Details | |
| Open to New Investors |
|
| Minimum Initial Investment | 1000.00 None |
| Minimum Subsequent Investment | 0.00 None |
Basic Info
| Investment Strategy | |
| The Fund seeks to provide investors with as high a level of current income as is consistent with the preservation of shareholder's capital and liquidity. The Fund also tries to maintain a stable $1 share price. The Fund invests mainly in high-quality, short-term U.S. dollar-denominated money market securities. |
| General | |
| Security Type | Money Market Fund |
| Equity Style | -- |
| Broad Asset Class | Money Market |
| Broad Category | Capital Preservation |
| Global Peer Group | Money Market USD |
| Peer Group | U.S. Government Money Market Funds |
| Global Macro | Money Market HC |
| US Macro | Taxable Money Market Funds |
| YCharts Categorization | -- |
| YCharts Benchmark | -- |
| Prospectus Objective | U.S. Government Money Market Funds |
| Fund Owner Firm Name | Franklin Templeton |
| Broad Asset Class Benchmark Index | |
| ^BBUTB13MTR | 100.0% |
Fundamentals
| General | |
| Distribution Yield | -- |
| Dividend Yield TTM (6-9-26) | 3.37% |
| 30-Day SEC Yield | -- |
| 7-Day SEC Yield (4-30-26) | 3.14% |
| Number of Holdings | 3 |
Fund Details
| Key Dates | |
| Launch Date | 9/4/2024 |
| Last Annual Report Date | 6/30/2025 |
| Last Prospectus Date | 11/1/2025 |
| Share Classes | |
| FMFXX | A |
| FRQXX | Retirement |
| FRRXX | Retirement |
| FTQXX | C |
| INFXX | Single Share Class |
| Attributes | |
| Index Fund | -- |
| Inverse Fund | No |
| Leveraged Fund | -- |
| Fund of Funds | No |
| Currency Hedged Fund | -- |
| Socially Responsible Fund | No |
Top Portfolio Holders
| Name | % Weight |
|---|---|
| Portfolio A | 5.00% |
| Portfolio B | 3.50% |
| Portfolio C | 2.25% |