

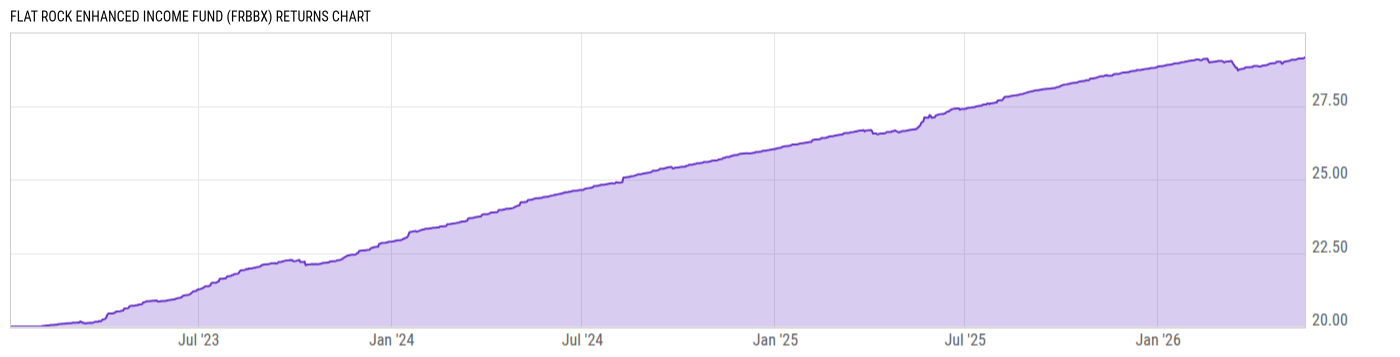
Flat Rock Enhanced Income Fund (FRBBX)
21.51
+0.02
(+0.09%)
USD |
May 21 2026
Returns Chart
Key Stats
| Net Expense Ratio | Total Assets Under Management | Weighted Average Dividend Yield | Turnover Ratio (Generic) |
|---|---|---|---|
| 3.55% | 714.11M | -- | 28.00% |
| 1 Year Fund Level Flows | 1 Year Total Returns (Daily) | Annualized Total Returns Since Inception (Daily) | Max Drawdown (Since Inception) |
| -- | 8.14% |
Basic Info
| Investment Strategy | |
| The Fund seeks to generate current income and long-term capital appreciation by investing in the junior debt tranches of collateralized loan obligations that own a pool of senior secured loans made to companies whose debt is rated below investment grade or, in limited circumstances, unrated (Senior Secured Loans). |
| General | |
| Security Type | Unlisted Closed-End Fund |
| Equity Style | -- |
| Broad Asset Class | Taxable Bond |
| Broad Category | Fixed Income |
| Global Peer Group | Loan Participation Funds |
| Peer Group | Loan Participation Funds |
| Global Macro | Loan Participation Funds |
| US Macro | General Domestic Taxable Fixed Income Funds |
| YCharts Categorization | -- |
| YCharts Benchmark | -- |
| Prospectus Objective | Loan Participation Funds |
| Fund Owner Firm Name | Flat Rock Global |
| Broad Asset Class Benchmark Index | |
| ^BBUSATR | 100.0% |
Net Fund Flows Versus Peer Group
1 Month
% Rank:
--
-253.42M
Peer Group Low
759.64M
Peer Group High
1 Year
% Rank:
--
-2.001B
Peer Group Low
5.560B
Peer Group High
3 Months
% Rank:
--
-1.463B
Peer Group Low
1.631B
Peer Group High
3 Years
% Rank:
--
-2.784B
Peer Group Low
21.89B
Peer Group High
6 Months
% Rank:
--
-1.675B
Peer Group Low
3.793B
Peer Group High
5 Years
% Rank:
--
-4.082B
Peer Group Low
24.26B
Peer Group High
YTD
% Rank:
--
-1.576B
Peer Group Low
2.664B
Peer Group High
10 Years
% Rank:
--
-10.84B
Peer Group Low
24.98B
Peer Group High
Date Unavailable
Risk
Performance Versus Peer Group
Annual Total Returns Versus Peers
As of May 22, 2026.
Asset Allocation
As of December 31, 2025.
| Type | % Net |
|---|---|
| Cash | 0.14% |
| Stock | 0.00% |
| Bond | 100.6% |
| Convertible | 0.00% |
| Preferred | 0.00% |
| Other | -0.74% |
Top 10 Holdings
| Name | % Weight | Price | % Change |
|---|---|---|---|
|
MONROE CAPITAL MML CLO LTD 16 E SEQ FLT 12.10899% 23-JUL-2036
|
4.09% | -- | -- |
|
GREAT LAKES CLO LTD 151R ER SEQ FLT 11.51524% 16-JAN-2030
|
3.67% | -- | -- |
|
MARANON LOAN FUNDING LTD 221R ER FLT 10.65454% 15-APR-2037
|
2.91% | -- | -- |
|
MARANON LOAN FUNDING LTD 213R ER SEQ FLT 12.13755% 15-OCT-2036
|
2.89% | -- | -- |
|
BAIN CAPITAL GLOBAL DIRECT LENDING FUND 2025 D FLT
|
2.80% | -- | -- |
|
THL CREDIT LAKE SHORE MM CLO LTD. 5 C FLT 16-OCT-2034
|
2.77% | -- | -- |
|
MARANON LOAN FUNDING LTD 231R ER SEQ FLT 12.07811% 15-JUL-2037
|
2.66% | -- | -- |
|
THL CREDIT LAKE SHORE MM CLO LTD. 2RR ERR SEQ FLT 12.53163% 17-OCT-2031
|
2.62% | -- | -- |
|
BRIGHTWOOD CAPITAL MM CLO 191R ER FLT 12.58755% 16-OCT-2034
|
2.62% | -- | -- |
|
GUGGENHEIM PRIVATE DEBT FUND NOTE LLC 4 D FLT 10-APR-2038
|
2.58% | -- | -- |
Fees & Availability
| Fees | |
| Actual 12B-1 Fee | -- |
| Actual Management Fee | 1.38% |
| Administration Fee | 372.1K% |
| Maximum Front Load | -- |
| Maximum Deferred Load | -- |
| Maximum Redemption Fee | -- |
| General Availability | |
| Available for Insurance Product | No |
| Available for RRSP | No |
| Purchase Details | |
| Open to New Investors |
|
| Minimum Initial Investment | 0.00 None |
| Minimum Subsequent Investment | 0.00 None |
Basic Info
| Investment Strategy | |
| The Fund seeks to generate current income and long-term capital appreciation by investing in the junior debt tranches of collateralized loan obligations that own a pool of senior secured loans made to companies whose debt is rated below investment grade or, in limited circumstances, unrated (Senior Secured Loans). |
| General | |
| Security Type | Unlisted Closed-End Fund |
| Equity Style | -- |
| Broad Asset Class | Taxable Bond |
| Broad Category | Fixed Income |
| Global Peer Group | Loan Participation Funds |
| Peer Group | Loan Participation Funds |
| Global Macro | Loan Participation Funds |
| US Macro | General Domestic Taxable Fixed Income Funds |
| YCharts Categorization | -- |
| YCharts Benchmark | -- |
| Prospectus Objective | Loan Participation Funds |
| Fund Owner Firm Name | Flat Rock Global |
| Broad Asset Class Benchmark Index | |
| ^BBUSATR | 100.0% |
Fundamentals
| General | |
| Distribution Yield | -- |
| Dividend Yield TTM (5-20-26) | 8.96% |
| 30-Day SEC Yield (6-30-24) | 6.35% |
| 7-Day SEC Yield | -- |
| Number of Holdings | 65 |
| Bond | |
| Yield to Maturity (12-31-25) | 9.78% |
| Effective Duration | -- |
| Average Coupon | 11.79% |
| Calculated Average Quality | 5.041 |
| Effective Maturity | 10.26 |
| Nominal Maturity | 10.26 |
| Number of Bond Holdings | 62 |
As of December 31, 2025
Fund Details
| Key Dates | |
| Launch Date | 1/3/2023 |
| Last Annual Report Date | 12/31/2025 |
| Last Prospectus Date | 4/28/2025 |
| Attributes | |
| Index Fund | -- |
| Inverse Fund | No |
| Leveraged Fund | -- |
| Fund of Funds | No |
| Currency Hedged Fund | -- |
| Socially Responsible Fund | No |
Top Portfolio Holders
| Name | % Weight |
|---|---|
| Portfolio A | 5.00% |
| Portfolio B | 3.50% |
| Portfolio C | 2.25% |