

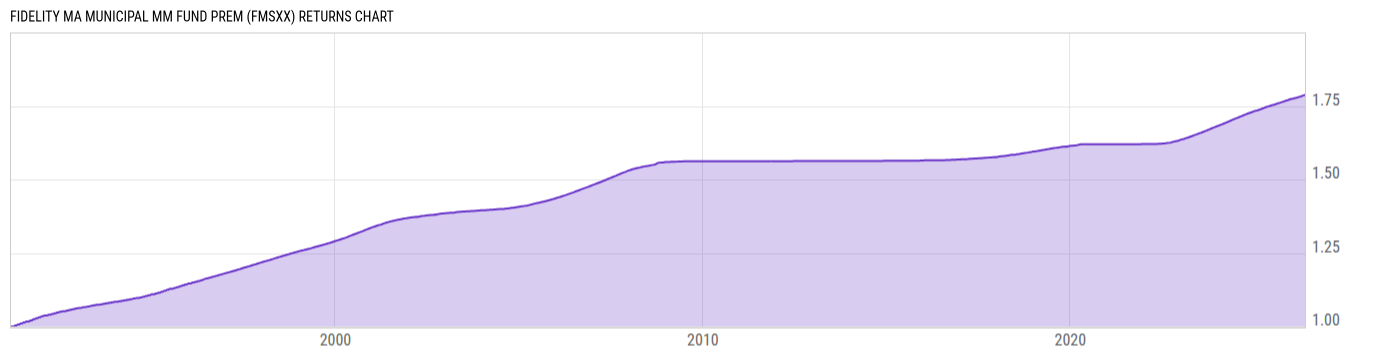
Fidelity MA Municipal MM Fund Prem (FMSXX)
1.00
0.00 (0.00%)
USD |
May 22 2026
Returns Chart
Key Stats
| Net Expense Ratio | Total Assets Under Management | Weighted Average Dividend Yield | Turnover Ratio (Generic) |
|---|---|---|---|
| 0.30% | 3.651B | -- | -- |
| 1 Year Fund Level Flows | 1 Year Total Returns (Daily) | Annualized Total Returns Since Inception (Daily) | Max Drawdown (Since Inception) |
| 230.62M | 2.23% |
Basic Info
| Investment Strategy | |
| The Fund seeks as high a level of current income exempt from federal income tax and Massachusetts personal income tax as is consistent with preservation of capital and liquidity. Invests in municipal securities. |
| General | |
| Security Type | Money Market Fund |
| Equity Style | -- |
| Broad Asset Class | Money Market |
| Broad Category | Capital Preservation |
| Global Peer Group | Bond USD Tax Exempt Money Market |
| Peer Group | Other States Tax-Exempt Money Market Fds |
| Global Macro | Bond HC |
| US Macro | Tax-Exempt Money Market Funds |
| YCharts Categorization | -- |
| YCharts Benchmark | -- |
| Prospectus Objective | Other States Tax-Exempt Money Market Fds |
| Fund Owner Firm Name | Fidelity Investments |
| Broad Asset Class Benchmark Index | |
| ^BBUTB13MTR | 100.0% |
Net Fund Flows Versus Peer Group
1 Month
% Rank:
25
-47737.00
Peer Group Low
51.50M
Peer Group High
1 Year
% Rank:
25
230.62M
-1.226M
Peer Group Low
230.62M
Peer Group High
3 Months
% Rank:
25
-2.127M
Peer Group Low
376.72M
Peer Group High
3 Years
% Rank:
25
593088.0
Peer Group Low
1.082B
Peer Group High
6 Months
% Rank:
25
2.630M
Peer Group Low
100.49M
Peer Group High
5 Years
% Rank:
25
2.916M
Peer Group Low
1.175B
Peer Group High
YTD
% Rank:
25
-3.460M
Peer Group Low
29.23M
Peer Group High
10 Years
% Rank:
25
-41.37M
Peer Group Low
1.747B
Peer Group High
Date Unavailable
Risk
Performance Versus Peer Group
Annual Total Returns Versus Peers
As of May 24, 2026.
Asset Allocation
As of April 30, 2026.
| Type | % Net |
|---|---|
| Cash | 17.90% |
| Stock | 0.00% |
| Bond | 82.10% |
| Convertible | 0.00% |
| Preferred | 0.00% |
| Other | 0.00% |
Top 10 Holdings
| Name | % Weight | Price | % Change |
|---|---|---|---|
|
Fidelity Municipal Cash Central Fund
|
13.67% | -- | -- |
| MASSACHUSETTS ST DEV FIN AGY REV MA 10/01/2064 | 3.65% | 100.00 | 0.00% |
| MASSACHUSETTS DEPT TRANSN MET HWY SYS REV MA 1.590 01/01/2039 | 3.36% | 100.00 | 0.00% |
| 03/01/2049 | 3.13% | -- | -- |
| MASSACHUSETTS ST HEALTH & EDL FACS AUTH REV MA 1.000 07/01/2031 | 2.73% | 100.00 | 0.00% |
| MASSACHUSETTS DEPT TRANSN MET HWY SYS REV MA 1.570 01/01/2037 | 2.25% | 100.00 | 0.00% |
| MASSACHUSETTS DEPT TRANSN MET HWY SYS REV MA 1.500 01/01/2037 | 2.14% | 100.00 | 0.00% |
| MASSACHUSETTS ST HEALTH & EDL FACS AUTH REV MA 07/01/2042 | 2.06% | 100.00 | 0.00% |
| MASSACHUSETTS ST HEALTH & EDL FACS AUTH REV MA 07/01/2042 | 2.06% | 100.00 | 0.00% |
| MASSACHUSETTS ST HEALTH & EDL FACS AUTH REV MA 1.700 07/01/2031 | 1.90% | 100.00 | 0.00% |
Fees & Availability
| Fees | |
| Actual 12B-1 Fee | -- |
| Actual Management Fee | 0.20% |
| Administration Fee | -- |
| Maximum Front Load | -- |
| Maximum Deferred Load | -- |
| Maximum Redemption Fee | -- |
| General Availability | |
| Available for Insurance Product | No |
| Available for RRSP | No |
| Purchase Details | |
| Open to New Investors |
|
| Minimum Initial Investment | 25000.00 None |
| Minimum Subsequent Investment | 0.00 None |
Basic Info
| Investment Strategy | |
| The Fund seeks as high a level of current income exempt from federal income tax and Massachusetts personal income tax as is consistent with preservation of capital and liquidity. Invests in municipal securities. |
| General | |
| Security Type | Money Market Fund |
| Equity Style | -- |
| Broad Asset Class | Money Market |
| Broad Category | Capital Preservation |
| Global Peer Group | Bond USD Tax Exempt Money Market |
| Peer Group | Other States Tax-Exempt Money Market Fds |
| Global Macro | Bond HC |
| US Macro | Tax-Exempt Money Market Funds |
| YCharts Categorization | -- |
| YCharts Benchmark | -- |
| Prospectus Objective | Other States Tax-Exempt Money Market Fds |
| Fund Owner Firm Name | Fidelity Investments |
| Broad Asset Class Benchmark Index | |
| ^BBUTB13MTR | 100.0% |
Fundamentals
| General | |
| Distribution Yield | -- |
| Dividend Yield TTM (5-22-26) | 2.20% |
| 30-Day SEC Yield (11-30-24) | 2.57% |
| 7-Day SEC Yield (4-30-26) | 2.89% |
| Number of Holdings | 259 |
| Bond | |
| Yield to Maturity (4-30-26) | -- |
| Effective Duration | -- |
| Average Coupon | -- |
| Calculated Average Quality | -- |
| Effective Maturity | -- |
| Nominal Maturity | -- |
| Number of Bond Holdings | 249 |
As of April 30, 2026
Fund Details
Top Portfolio Holders
| Name | % Weight |
|---|---|
| Portfolio A | 5.00% |
| Portfolio B | 3.50% |
| Portfolio C | 2.25% |