

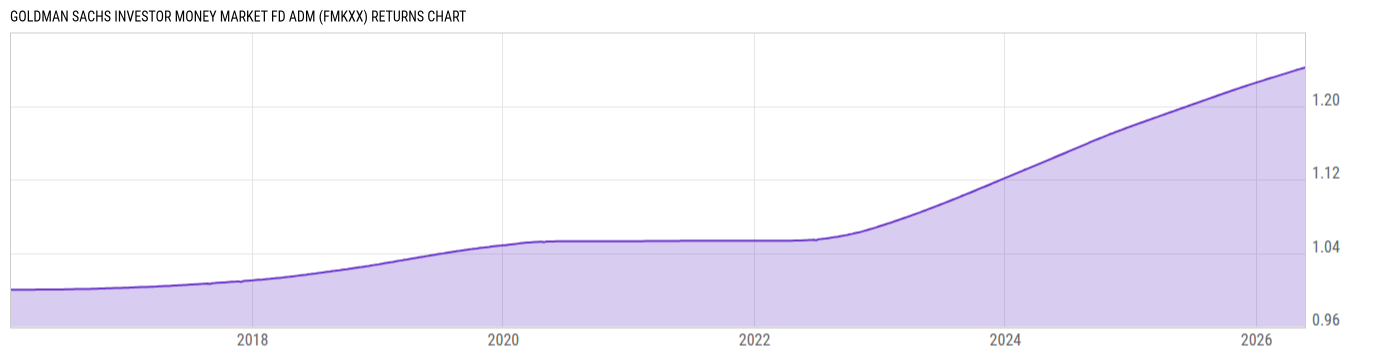
Goldman Sachs Investor Money Market Fd Adm (FMKXX)
1.00
0.00 (0.00%)
USD |
Jun 09 2026
Returns Chart
Key Stats
| Net Expense Ratio | Total Assets Under Management | Weighted Average Dividend Yield | Turnover Ratio (Generic) |
|---|---|---|---|
| 0.43% | 12.58B | -- | -- |
| 1 Year Fund Level Flows | 1 Year Total Returns (Daily) | Annualized Total Returns Since Inception (Daily) | Max Drawdown (Since Inception) |
| 723.27M | 3.66% |
Basic Info
| Investment Strategy | |
| The Fund seeks to maximize current income to the extent consistent with the preservation of capital and the maintenance of liquidity by investing exclusively in high quality money market instruments. The Fund invests in securities issued or guaranteed by certain U.S. government agencies or instrumentalities. |
| General | |
| Security Type | Money Market Fund |
| Equity Style | -- |
| Broad Asset Class | Money Market |
| Broad Category | Capital Preservation |
| Global Peer Group | Money Market USD |
| Peer Group | Money Market Funds |
| Global Macro | Money Market HC |
| US Macro | Taxable Money Market Funds |
| YCharts Categorization | -- |
| YCharts Benchmark | -- |
| Prospectus Objective | Money Market Funds |
| Fund Owner Firm Name | Goldman Sachs |
| Broad Asset Class Benchmark Index | |
| ^BBUTB13MTR | 100.0% |
Net Fund Flows Versus Peer Group
1 Month
% Rank:
20
-461.26M
Peer Group Low
1.539B
Peer Group High
1 Year
% Rank:
44
723.27M
-8.251B
Peer Group Low
14.16B
Peer Group High
3 Months
% Rank:
60
-4.836B
Peer Group Low
83.19M
Peer Group High
3 Years
% Rank:
46
-1.574B
Peer Group Low
154.90B
Peer Group High
6 Months
% Rank:
5
-5.502B
Peer Group Low
149.91M
Peer Group High
5 Years
% Rank:
39
-2.118B
Peer Group Low
271.50B
Peer Group High
YTD
% Rank:
5
-6.442B
Peer Group Low
80.60M
Peer Group High
10 Years
% Rank:
39
-39.66B
Peer Group Low
336.94B
Peer Group High
Date Unavailable
Risk
Performance Versus Peer Group
Annual Total Returns Versus Peers
As of June 11, 2026.
Asset Allocation
As of April 30, 2026.
| Type | % Net |
|---|---|
| Cash | 73.58% |
| Stock | 0.00% |
| Bond | 25.76% |
| Convertible | 0.00% |
| Preferred | 0.66% |
| Other | 0.00% |
Top 10 Holdings
| Name | % Weight | Price | % Change |
|---|---|---|---|
|
Morgan Stanley & Co LLC Repo
|
13.04% | -- | -- |
|
Bank of Nova Scotia Repo
|
4.07% | -- | -- |
|
TD Securities USA LLC REPO
|
3.46% | -- | -- |
|
JPMorgan Securities LLC Repo
|
3.46% | -- | -- |
|
Societe Generale SA Repo
|
2.44% | -- | -- |
|
Repo General Security
|
2.33% | -- | -- |
|
BNP Paribas Repo
|
2.21% | -- | -- |
|
Wells Fargo Securities LLC Repo
|
1.91% | -- | -- |
| United States of America USGB 07/31/2027 FLT USD Government | 1.53% | 100.18 | 0.02% |
|
Royal Bank of Canada Time/Term Deposit
|
1.38% | -- | -- |
Fees & Availability
| Fees | |
| Actual 12B-1 Fee | -- |
| Actual Management Fee | 0.15% |
| Administration Fee | -- |
| Maximum Front Load | -- |
| Maximum Deferred Load | -- |
| Maximum Redemption Fee | -- |
| General Availability | |
| Available for Insurance Product | No |
| Available for RRSP | No |
| Purchase Details | |
| Open to New Investors |
|
| Minimum Initial Investment | 10.00M None |
| Minimum Subsequent Investment | 0.00 None |
Basic Info
| Investment Strategy | |
| The Fund seeks to maximize current income to the extent consistent with the preservation of capital and the maintenance of liquidity by investing exclusively in high quality money market instruments. The Fund invests in securities issued or guaranteed by certain U.S. government agencies or instrumentalities. |
| General | |
| Security Type | Money Market Fund |
| Equity Style | -- |
| Broad Asset Class | Money Market |
| Broad Category | Capital Preservation |
| Global Peer Group | Money Market USD |
| Peer Group | Money Market Funds |
| Global Macro | Money Market HC |
| US Macro | Taxable Money Market Funds |
| YCharts Categorization | -- |
| YCharts Benchmark | -- |
| Prospectus Objective | Money Market Funds |
| Fund Owner Firm Name | Goldman Sachs |
| Broad Asset Class Benchmark Index | |
| ^BBUTB13MTR | 100.0% |
Fundamentals
| General | |
| Distribution Yield | -- |
| Dividend Yield TTM (6-9-26) | 3.70% |
| 30-Day SEC Yield | -- |
| 7-Day SEC Yield (4-30-26) | 3.42% |
| Number of Holdings | 307 |
| Bond | |
| Yield to Maturity (4-30-26) | -- |
| Effective Duration | -- |
| Average Coupon | -- |
| Calculated Average Quality | -- |
| Effective Maturity | -- |
| Nominal Maturity | -- |
| Number of Bond Holdings | 117 |
As of April 30, 2026
Fund Details
| Key Dates | |
| Inception Date | 1/29/2016 |
| Last Annual Report Date | 11/30/2025 |
| Last Prospectus Date | 3/30/2026 |
| Share Classes | |
| FHMXX | Other |
| FHSXX | Service |
| FMDXX | D |
| FMEXX | A |
| FMGXX | C |
| FMJXX | Inst |
| Attributes | |
| Index Fund | -- |
| Inverse Fund | No |
| Leveraged Fund | -- |
| Fund of Funds | No |
| Currency Hedged Fund | -- |
| Socially Responsible Fund | No |
Top Portfolio Holders
| Name | % Weight |
|---|---|
| Portfolio A | 5.00% |
| Portfolio B | 3.50% |
| Portfolio C | 2.25% |