

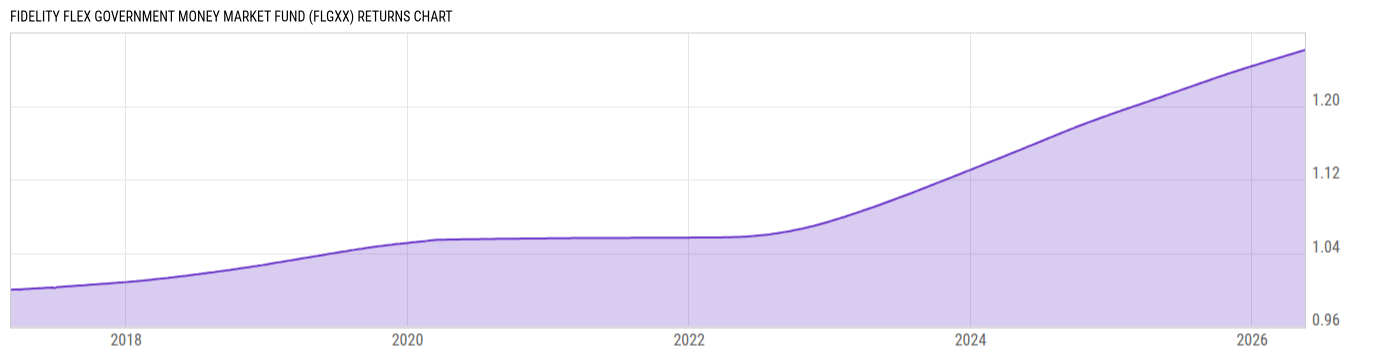
Fidelity Flex Government Money Market Fund (FLGXX)
1.00
0.00 (0.00%)
USD |
Jun 09 2026
Returns Chart
Key Stats
| Net Expense Ratio | Total Assets Under Management | Weighted Average Dividend Yield | Turnover Ratio (Generic) |
|---|---|---|---|
| 0.00% | 207.34M | -- | -- |
| 1 Year Fund Level Flows | 1 Year Total Returns (Daily) | Annualized Total Returns Since Inception (Daily) | Max Drawdown (Since Inception) |
| 58.06M | 3.99% |
Basic Info
| Investment Strategy | |
| The Fund seeks as high a level of current income as is consistent with preservation of capital and liquidity. It will Normally invest at least 99.5% of total assets in cash, U.S. Government securities and/or repurchase agreements that are collateralized fully (i.e., collateralized by cash or government securities). |
| General | |
| Security Type | Money Market Fund |
| Equity Style | -- |
| Broad Asset Class | Money Market |
| Broad Category | Capital Preservation |
| Global Peer Group | Money Market USD |
| Peer Group | Instl U.S. Government Money Market Funds |
| Global Macro | Money Market HC |
| US Macro | Taxable Money Market Funds |
| YCharts Categorization | -- |
| YCharts Benchmark | -- |
| Prospectus Objective | Instl U.S. Government Money Market Funds |
| Fund Owner Firm Name | Fidelity Investments |
| Broad Asset Class Benchmark Index | |
| ^BBUTB13MTR | 100.0% |
Net Fund Flows Versus Peer Group
1 Month
% Rank:
41
-7.017B
Peer Group Low
25.65B
Peer Group High
1 Year
% Rank:
65
58.06M
-5.811B
Peer Group Low
46.82B
Peer Group High
3 Months
% Rank:
31
-21.49B
Peer Group Low
13.98B
Peer Group High
3 Years
% Rank:
67
-19.08B
Peer Group Low
149.96B
Peer Group High
6 Months
% Rank:
39
-13.14B
Peer Group Low
26.50B
Peer Group High
5 Years
% Rank:
71
-37.54B
Peer Group Low
190.74B
Peer Group High
YTD
% Rank:
31
-17.29B
Peer Group Low
20.47B
Peer Group High
10 Years
% Rank:
85
-14.28B
Peer Group Low
341.23B
Peer Group High
Date Unavailable
Risk
Performance Versus Peer Group
Annual Total Returns Versus Peers
As of June 10, 2026.
Asset Allocation
As of April 30, 2026.
| Type | % Net |
|---|---|
| Cash | 38.46% |
| Stock | 0.00% |
| Bond | 61.54% |
| Convertible | 0.00% |
| Preferred | 0.00% |
| Other | 0.00% |
Top 10 Holdings
| Name | % Weight | Price | % Change |
|---|---|---|---|
|
Fixed Income Clearing Corp Repo
|
17.26% | -- | -- |
| United States of America USGB 0.0 09/24/2026 FIX USD Government | 4.03% | 98.93 | 0.01% |
|
JPMorgan Securities LLC Repo
|
3.90% | -- | -- |
|
Morgan Stanley & Co LLC Repo
|
1.82% | -- | -- |
|
Canadian Imperial Bank of Commerce Repo
|
1.82% | -- | -- |
| United States of America USGB 4.375 08/15/2026 FIX USD Government | 1.37% | 100.11 | 0.00% |
|
Bank of Montreal (Chicago Branch) Repo
|
1.36% | -- | -- |
|
Lloyds Bank PLC Repo
|
1.36% | -- | -- |
|
Bofa Securities Inc Repo
|
1.36% | -- | -- |
|
MUFG Securities EMEA PLC Repo
|
1.36% | -- | -- |
Fees & Availability
| Fees | |
| Actual 12B-1 Fee | -- |
| Actual Management Fee | 0.00% |
| Administration Fee | -- |
| Maximum Front Load | -- |
| Maximum Deferred Load | -- |
| Maximum Redemption Fee | -- |
| General Availability | |
| Available for Insurance Product | No |
| Available for RRSP | No |
| Purchase Details | |
| Open to New Investors |
|
| Minimum Initial Investment | 0.00 None |
| Minimum Subsequent Investment | 0.00 None |
Basic Info
| Investment Strategy | |
| The Fund seeks as high a level of current income as is consistent with preservation of capital and liquidity. It will Normally invest at least 99.5% of total assets in cash, U.S. Government securities and/or repurchase agreements that are collateralized fully (i.e., collateralized by cash or government securities). |
| General | |
| Security Type | Money Market Fund |
| Equity Style | -- |
| Broad Asset Class | Money Market |
| Broad Category | Capital Preservation |
| Global Peer Group | Money Market USD |
| Peer Group | Instl U.S. Government Money Market Funds |
| Global Macro | Money Market HC |
| US Macro | Taxable Money Market Funds |
| YCharts Categorization | -- |
| YCharts Benchmark | -- |
| Prospectus Objective | Instl U.S. Government Money Market Funds |
| Fund Owner Firm Name | Fidelity Investments |
| Broad Asset Class Benchmark Index | |
| ^BBUTB13MTR | 100.0% |
Fundamentals
| General | |
| Distribution Yield | -- |
| Dividend Yield TTM (6-9-26) | 4.03% |
| 30-Day SEC Yield (11-30-24) | 4.73% |
| 7-Day SEC Yield (5-31-26) | 3.71% |
| Number of Holdings | 134 |
| Bond | |
| Yield to Maturity (4-30-26) | -- |
| Effective Duration | -- |
| Average Coupon | -- |
| Calculated Average Quality | -- |
| Effective Maturity | -- |
| Nominal Maturity | -- |
| Number of Bond Holdings | 107 |
As of April 30, 2026
Fund Details
| Key Dates | |
| Launch Date | 3/8/2017 |
| Last Annual Report Date | 4/30/2025 |
| Last Prospectus Date | 6/28/2025 |
| Attributes | |
| Index Fund | -- |
| Inverse Fund | No |
| Leveraged Fund | -- |
| Fund of Funds | No |
| Currency Hedged Fund | -- |
| Socially Responsible Fund | No |
Top Portfolio Holders
| Name | % Weight |
|---|---|
| Portfolio A | 5.00% |
| Portfolio B | 3.50% |
| Portfolio C | 2.25% |