

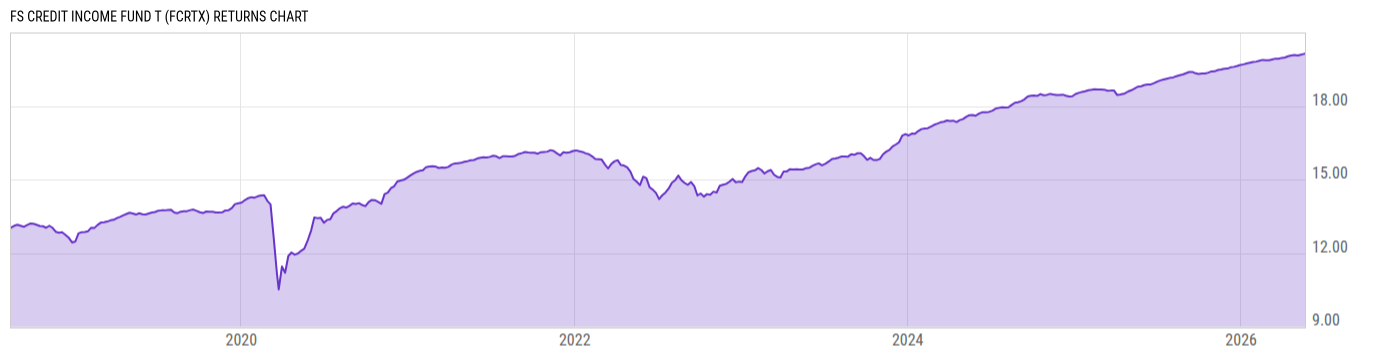
FS Credit Income Fund T (FCRTX)
11.87
0.00 (0.00%)
USD |
May 21 2026
Returns Chart
Key Stats
| Net Expense Ratio | Total Assets Under Management | Weighted Average Dividend Yield | Turnover Ratio (Generic) |
|---|---|---|---|
| 3.37% | 680.58M | -- | 140.0% |
| 1 Year Fund Level Flows | 1 Year Total Returns (Daily) | Annualized Total Returns Since Inception (Daily) | Max Drawdown (Since Inception) |
| -- | 7.11% |
Basic Info
| Investment Strategy | |
| The Fund seeks to provide attractive total returns, which will include current income and capital appreciation. The Fund, under normal conditions, will invest at least 80% of its assets (including borrowings for investment purposes) in debt obligations. The Fund intends to use leverage to pursue its investment objective. |
| General | |
| Security Type | Unlisted Closed-End Fund |
| Equity Style | -- |
| Broad Asset Class | Taxable Bond |
| Broad Category | Fixed Income |
| Global Peer Group | Bond USD |
| Peer Group | General Bond Funds |
| Global Macro | Bond HC |
| US Macro | General Domestic Taxable Fixed Income Funds |
| YCharts Categorization | -- |
| YCharts Benchmark | -- |
| Prospectus Objective | General Bond Funds |
| Fund Owner Firm Name | Future Standard |
| Broad Asset Class Benchmark Index | |
| ^BBUSATR | 100.0% |
Net Fund Flows Versus Peer Group
1 Month
% Rank:
--
-3.511B
Peer Group Low
288.35M
Peer Group High
1 Year
% Rank:
--
-641.24M
Peer Group Low
13.23B
Peer Group High
3 Months
% Rank:
--
-2.235B
Peer Group Low
1.456B
Peer Group High
3 Years
% Rank:
--
-12.70B
Peer Group Low
18.00B
Peer Group High
6 Months
% Rank:
--
-3.509B
Peer Group Low
2.976B
Peer Group High
5 Years
% Rank:
--
-1.455B
Peer Group Low
49.86B
Peer Group High
YTD
% Rank:
--
-2.080B
Peer Group Low
2.002B
Peer Group High
10 Years
% Rank:
--
-1.866B
Peer Group Low
81.23B
Peer Group High
Date Unavailable
Risk
Performance Versus Peer Group
Annual Total Returns Versus Peers
As of May 22, 2026.
Asset Allocation
As of October 31, 2025.
| Type | % Net |
|---|---|
| Cash | 15.60% |
| Stock | 0.03% |
| Bond | 93.39% |
| Convertible | 0.00% |
| Preferred | 0.00% |
| Other | -9.03% |
Top 10 Holdings
| Name | % Weight | Price | % Change |
|---|---|---|---|
|
USD Cash
|
15.60% | -- | -- |
| United States of America USGB 11/25/2025 FIX USD Government (Matured) | 15.20% | 100.00 | 0.00% |
|
Lawn & Garden LLC FRN 21-Oct-2029
|
3.65% | -- | -- |
|
Hexion Inc Term Loan
|
1.54% | -- | -- |
|
Firmus Metal Singapore Pte Ltd FRN 12-Jun-2029
|
1.43% | -- | -- |
|
Massiv Brands LLC PIK FRN 02-Jul-2030
|
1.39% | -- | -- |
|
HMP Omnimedia LLC 30-JUL-2032 Delay Draw Term Loan
|
1.37% | -- | -- |
|
Mood Media Borrower FRN 30-May-2030
|
1.36% | -- | -- |
| NEW FLYER HOLDINGS, INC. NEFLYE 9.25 07/01/2030 FIX USD Corporate 144A | 1.30% | 107.42 | 0.00% |
|
Phoenix Rehabilitation And Health Services Inc FRN 29-Sep-2030
|
1.26% | -- | -- |
Fees & Availability
| Fees | |
| Actual 12B-1 Fee | 0.25% |
| Actual Management Fee | 1.02% |
| Administration Fee | 2.38K% |
| Maximum Front Load | 3.50% |
| Maximum Deferred Load | -- |
| Maximum Redemption Fee | -- |
| General Availability | |
| Available for Insurance Product | No |
| Available for RRSP | No |
| Purchase Details | |
| Open to New Investors |
|
| Minimum Initial Investment | 2500.00 None |
| Minimum Subsequent Investment | 100.00 None |
Basic Info
| Investment Strategy | |
| The Fund seeks to provide attractive total returns, which will include current income and capital appreciation. The Fund, under normal conditions, will invest at least 80% of its assets (including borrowings for investment purposes) in debt obligations. The Fund intends to use leverage to pursue its investment objective. |
| General | |
| Security Type | Unlisted Closed-End Fund |
| Equity Style | -- |
| Broad Asset Class | Taxable Bond |
| Broad Category | Fixed Income |
| Global Peer Group | Bond USD |
| Peer Group | General Bond Funds |
| Global Macro | Bond HC |
| US Macro | General Domestic Taxable Fixed Income Funds |
| YCharts Categorization | -- |
| YCharts Benchmark | -- |
| Prospectus Objective | General Bond Funds |
| Fund Owner Firm Name | Future Standard |
| Broad Asset Class Benchmark Index | |
| ^BBUSATR | 100.0% |
Fundamentals
| General | |
| Distribution Yield | -- |
| Dividend Yield TTM (5-20-26) | 9.35% |
| 30-Day SEC Yield | -- |
| 7-Day SEC Yield | -- |
| Number of Holdings | 89 |
| Bond | |
| Yield to Maturity (10-31-25) | 4.49% |
| Effective Duration | -- |
| Average Coupon | 8.26% |
| Calculated Average Quality | 6.059 |
| Effective Maturity | 3.670 |
| Nominal Maturity | 3.670 |
| Number of Bond Holdings | 84 |
As of October 31, 2025
Fund Details
Top Portfolio Holders
| Name | % Weight |
|---|---|
| Portfolio A | 5.00% |
| Portfolio B | 3.50% |
| Portfolio C | 2.25% |