

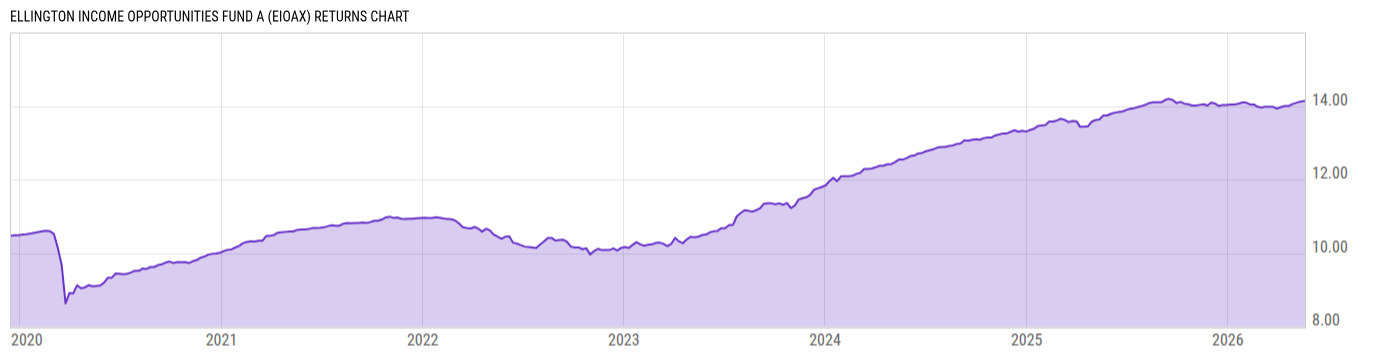
Ellington Income Opportunities Fund A (EIOAX)
8.34
0.00 (0.00%)
USD |
May 21 2026
Returns Chart
Key Stats
| Net Expense Ratio | Total Assets Under Management | Weighted Average Dividend Yield | Turnover Ratio (Generic) |
|---|---|---|---|
| 3.18% | 37.60M | -- | 93.00% |
| 1 Year Fund Level Flows | 1 Year Total Returns (Daily) | Annualized Total Returns Since Inception (Daily) | Max Drawdown (Since Inception) |
| -- | 2.86% |
Basic Info
| Investment Strategy | |
| The Fund seeks total return, including capital gains and current income. The Fund employs an opportunistic strategy to pursue value and current income across various types of mortgage-related, consumer-related, and corporate-related debt and other financial assets, including through investments primarily in securities. |
| General | |
| Security Type | Unlisted Closed-End Fund |
| Equity Style | -- |
| Broad Asset Class | Taxable Bond |
| Broad Category | Fixed Income |
| Global Peer Group | Bond USD Mortgages |
| Peer Group | U.S. Mortgage Funds |
| Global Macro | Bond HC |
| US Macro | U.S. Government & Treasury Fixed Income Funds |
| YCharts Categorization | -- |
| YCharts Benchmark | -- |
| Prospectus Objective | U.S. Mortgage Funds |
| Fund Owner Firm Name | Ellington Income Opportunities Fund |
| Broad Asset Class Benchmark Index | |
| ^BBUSATR | 100.0% |
Net Fund Flows Versus Peer Group
1 Month
% Rank:
--
-478.98M
Peer Group Low
425.34M
Peer Group High
1 Year
% Rank:
--
-1.067B
Peer Group Low
1.278B
Peer Group High
3 Months
% Rank:
--
-1.037B
Peer Group Low
372.55M
Peer Group High
3 Years
% Rank:
--
-6.471B
Peer Group Low
7.384B
Peer Group High
6 Months
% Rank:
--
-3.987B
Peer Group Low
734.51M
Peer Group High
5 Years
% Rank:
--
-18.54B
Peer Group Low
10.19B
Peer Group High
YTD
% Rank:
--
-930.89M
Peer Group Low
632.98M
Peer Group High
10 Years
% Rank:
--
-35.01B
Peer Group Low
25.87B
Peer Group High
Date Unavailable
Risk
Performance Versus Peer Group
Annual Total Returns Versus Peers
As of May 22, 2026.
Asset Allocation
As of December 31, 2025.
| Type | % Net |
|---|---|
| Cash | 4.04% |
| Stock | 0.00% |
| Bond | 88.63% |
| Convertible | 0.00% |
| Preferred | 4.53% |
| Other | 2.80% |
Top 10 Holdings
| Name | % Weight | Price | % Change |
|---|---|---|---|
|
USD Cash
|
13.36% | -- | -- |
|
OPORTUN FUNDING LLC 25A D SEQ FIX 7.25% 08-FEB-2033
|
4.29% | -- | -- |
|
BLACK DIAMOND CLO LTD. 221 E FLT 11.35798% 25-OCT-2035
|
4.01% | -- | -- |
|
CIFC FUNDING LTD 133RR D SEQ FLT 10.4803% 24-APR-2031
|
4.00% | -- | -- |
|
ELEVATION CLO LTD 131RRR ER3 26-JUL-2038
|
3.95% | -- | -- |
|
A&D MORTGAGE TRUST 24NQM1 B1 SEQ VAR 8.4743% 25-FEB-2069
|
3.83% | -- | -- |
|
SANTANDER BANK, N.A. 24B F FIX 8.881% 15-DEC-2032
|
3.56% | -- | -- |
|
FORTRESS CREDIT BSL LIMITED 10R ER SEQ FLT 20-APR-2033
|
3.28% | -- | -- |
|
BBCMS TRUST 18CHRS E SEQ VAR 4.2665% 06-AUG-2038
|
3.26% | -- | -- |
| AGNC Investment Corp. AGNCINV 8.63171 12/31/2099 FLT USD Corporate '25 | 3.26% | 25.67 | 0.00% |
Fees & Availability
| Fees | |
| Actual 12B-1 Fee | -- |
| Actual Management Fee | 0.55% |
| Administration Fee | 1.49K% |
| Maximum Front Load | 5.75% |
| Maximum Deferred Load | -- |
| Maximum Redemption Fee | -- |
| General Availability | |
| Available for Insurance Product | No |
| Available for RRSP | No |
| Purchase Details | |
| Open to New Investors |
|
| Minimum Initial Investment | 2500.00 None |
| Minimum Subsequent Investment | 100.00 None |
Basic Info
| Investment Strategy | |
| The Fund seeks total return, including capital gains and current income. The Fund employs an opportunistic strategy to pursue value and current income across various types of mortgage-related, consumer-related, and corporate-related debt and other financial assets, including through investments primarily in securities. |
| General | |
| Security Type | Unlisted Closed-End Fund |
| Equity Style | -- |
| Broad Asset Class | Taxable Bond |
| Broad Category | Fixed Income |
| Global Peer Group | Bond USD Mortgages |
| Peer Group | U.S. Mortgage Funds |
| Global Macro | Bond HC |
| US Macro | U.S. Government & Treasury Fixed Income Funds |
| YCharts Categorization | -- |
| YCharts Benchmark | -- |
| Prospectus Objective | U.S. Mortgage Funds |
| Fund Owner Firm Name | Ellington Income Opportunities Fund |
| Broad Asset Class Benchmark Index | |
| ^BBUSATR | 100.0% |
Fundamentals
| General | |
| Distribution Yield | -- |
| Dividend Yield TTM (5-20-26) | 9.29% |
| 30-Day SEC Yield | -- |
| 7-Day SEC Yield | -- |
| Number of Holdings | 67 |
| Bond | |
| Yield to Maturity (12-31-25) | 8.72% |
| Effective Duration | -- |
| Average Coupon | 7.86% |
| Calculated Average Quality | 4.644 |
| Effective Maturity | 11.49 |
| Nominal Maturity | 11.49 |
| Number of Bond Holdings | 58 |
As of December 31, 2025
Fund Details
| Key Dates | |
| Launch Date | 12/16/2019 |
| Last Annual Report Date | 12/31/2025 |
| Last Prospectus Date | 4/30/2025 |
| Share Classes | |
| EIOMX | Inst |
| Attributes | |
| Index Fund | -- |
| Inverse Fund | No |
| Leveraged Fund |
|
| Fund of Funds | No |
| Currency Hedged Fund | -- |
| Socially Responsible Fund | No |
Top Portfolio Holders
| Name | % Weight |
|---|---|
| Portfolio A | 5.00% |
| Portfolio B | 3.50% |
| Portfolio C | 2.25% |