

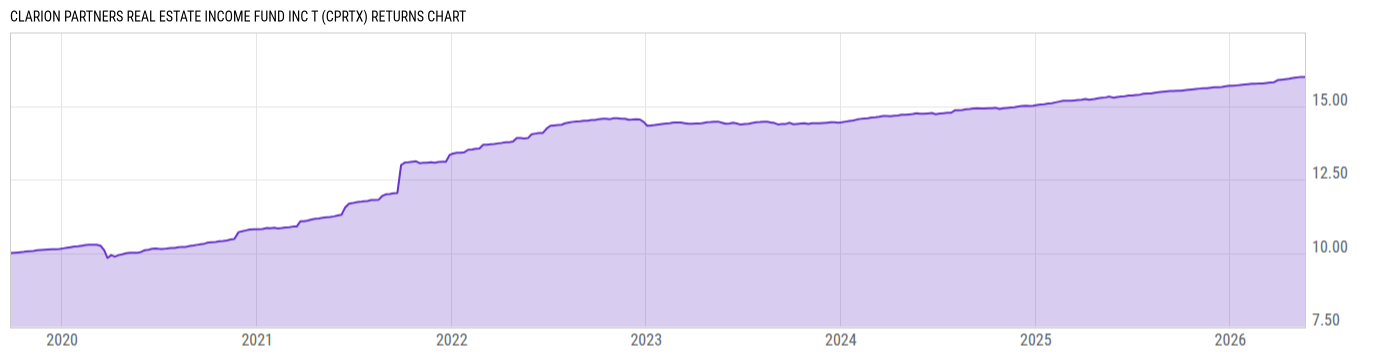
Clarion Partners Real Estate Income Fund Inc T (CPRTX)
11.33
0.00 (0.00%)
USD |
May 21 2026
Returns Chart
Key Stats
| Net Expense Ratio | Total Assets Under Management | Weighted Average Dividend Yield | Turnover Ratio (Generic) |
|---|---|---|---|
| 3.74% | 1.351B | -- | 13.00% |
| 1 Year Fund Level Flows | 1 Year Total Returns (Daily) | Annualized Total Returns Since Inception (Daily) | Max Drawdown (Since Inception) |
| -- | 4.33% |
Basic Info
| Investment Strategy | |
| The Fund seeks current income and long-term capital appreciation. The Fund intends under normal market conditions to invest at least 80% of its net assets, plus the amount of borrowings for investment purposes, in a portfolio of private commercial real estate and publicly traded real estate securities. |
| General | |
| Security Type | Unlisted Closed-End Fund |
| Equity Style | -- |
| Broad Asset Class | Sector Equity |
| Broad Category | Equity |
| Global Peer Group | Equity Sector Real Estate US |
| Peer Group | Real Estate Funds |
| Global Macro | Equity Real Estate |
| US Macro | Sector Equity Funds |
| YCharts Categorization | -- |
| YCharts Benchmark | -- |
| Prospectus Objective | Real Estate Funds |
| Fund Owner Firm Name | Clarion Partners |
| Broad Asset Class Benchmark Index | |
| ^MSWNTR | 100.0% |
Net Fund Flows Versus Peer Group
1 Month
% Rank:
--
-1.958B
Peer Group Low
250.50M
Peer Group High
1 Year
% Rank:
--
-1.347B
Peer Group Low
929.48M
Peer Group High
3 Months
% Rank:
--
-1.898B
Peer Group Low
306.86M
Peer Group High
3 Years
% Rank:
--
-6.202B
Peer Group Low
2.527B
Peer Group High
6 Months
% Rank:
--
-1.720B
Peer Group Low
599.29M
Peer Group High
5 Years
% Rank:
--
-5.705B
Peer Group Low
3.751B
Peer Group High
YTD
% Rank:
--
-1.797B
Peer Group Low
318.65M
Peer Group High
10 Years
% Rank:
--
-7.424B
Peer Group Low
6.609B
Peer Group High
Date Unavailable
Risk
Performance Versus Peer Group
Annual Total Returns Versus Peers
As of May 22, 2026.
Asset Allocation
As of February 28, 2026.
| Type | % Net |
|---|---|
| Cash | 2.43% |
| Stock | 0.00% |
| Bond | 26.65% |
| Convertible | 0.00% |
| Preferred | 0.37% |
| Other | 70.55% |
Top 10 Holdings
| Name | % Weight | Price | % Change |
|---|---|---|---|
|
CERBERUS-OUTOUR IOS PROPERTY
|
4.92% | -- | -- |
|
PACIFIC GOLDEN VALLEY
|
4.68% | -- | -- |
|
ROJAS EAST PROPERTY
|
3.97% | -- | -- |
|
WEAVERVILLE RETREAT PROPERTY
|
3.94% | -- | -- |
|
AGELLAN PORTFOLIO III PROPERTY
|
3.70% | -- | -- |
|
THE PEARL AT BOULDER CREEK
|
3.41% | -- | -- |
|
VITALITY LIVING FRANKLIN PROPERTY
|
3.26% | -- | -- |
|
THE BILTMORE APARTMENTS PROPERTY
|
3.18% | -- | -- |
| Dreyfus Government Cash Management Institutional | 3.11% | 1.00 | 0.00% |
|
6810 TENTH STREET PROPERTY
|
3.00% | -- | -- |
Fees & Availability
| Fees | |
| Actual 12B-1 Fee | 0.85% |
| Actual Management Fee | 1.25% |
| Administration Fee | -- |
| Maximum Front Load | 3.00% |
| Maximum Deferred Load | -- |
| Maximum Redemption Fee | 2.00% |
| General Availability | |
| Available for Insurance Product | No |
| Available for RRSP | No |
| Purchase Details | |
| Open to New Investors |
|
| Minimum Initial Investment | 2500.00 None |
| Minimum Subsequent Investment | 500.00 None |
Basic Info
| Investment Strategy | |
| The Fund seeks current income and long-term capital appreciation. The Fund intends under normal market conditions to invest at least 80% of its net assets, plus the amount of borrowings for investment purposes, in a portfolio of private commercial real estate and publicly traded real estate securities. |
| General | |
| Security Type | Unlisted Closed-End Fund |
| Equity Style | -- |
| Broad Asset Class | Sector Equity |
| Broad Category | Equity |
| Global Peer Group | Equity Sector Real Estate US |
| Peer Group | Real Estate Funds |
| Global Macro | Equity Real Estate |
| US Macro | Sector Equity Funds |
| YCharts Categorization | -- |
| YCharts Benchmark | -- |
| Prospectus Objective | Real Estate Funds |
| Fund Owner Firm Name | Clarion Partners |
| Broad Asset Class Benchmark Index | |
| ^MSWNTR | 100.0% |
Fundamentals
| General | |
| Distribution Yield | -- |
| Dividend Yield TTM (5-20-26) | 6.38% |
| 30-Day SEC Yield | -- |
| 7-Day SEC Yield | -- |
| Number of Holdings | 10 |
Top Portfolio Holders
| Name | % Weight |
|---|---|
| Portfolio A | 5.00% |
| Portfolio B | 3.50% |
| Portfolio C | 2.25% |