

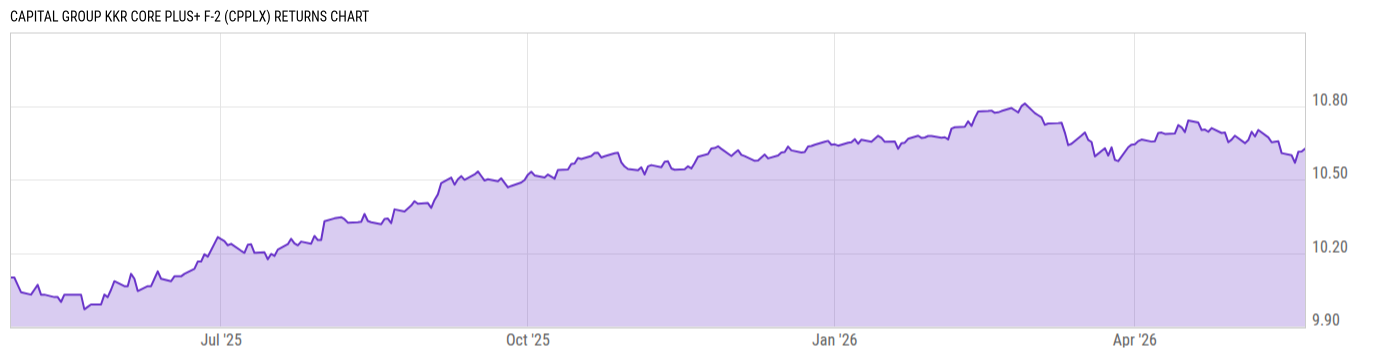
Capital Group KKR Core Plus+ F-2 (CPPLX)
9.90
+0.01
(+0.10%)
USD |
May 22 2026
Returns Chart
Key Stats
| Net Expense Ratio | Total Assets Under Management | Weighted Average Dividend Yield | Turnover Ratio (Generic) |
|---|---|---|---|
| 0.95% | 227.33M | -- | -- |
| 1 Year Fund Level Flows | 1 Year Total Returns (Daily) | Annualized Total Returns Since Inception (Daily) | Max Drawdown (Since Inception) |
| -- | 6.47% |
Basic Info
| Investment Strategy | |
| The Fund seeks to provide a high level of current income and seek maximum total return, consistent with preservation of capital by investing in both publicly traded fixed income securities and private credit loans and securities, which include private corporate direct lending and asset-based finance investments. |
| General | |
| Security Type | Unlisted Closed-End Fund |
| Equity Style | -- |
| Broad Asset Class | Taxable Bond |
| Broad Category | Fixed Income |
| Global Peer Group | Bond USD |
| Peer Group | General Bond Funds |
| Global Macro | Bond HC |
| US Macro | General Domestic Taxable Fixed Income Funds |
| YCharts Categorization | -- |
| YCharts Benchmark | -- |
| Prospectus Objective | General Bond Funds |
| Fund Owner Firm Name | Capital Group/American Funds |
| Broad Asset Class Benchmark Index | |
| ^BBUSATR | 100.0% |
Net Fund Flows Versus Peer Group
1 Month
% Rank:
--
-3.511B
Peer Group Low
288.35M
Peer Group High
1 Year
% Rank:
--
-641.24M
Peer Group Low
13.23B
Peer Group High
3 Months
% Rank:
--
-2.235B
Peer Group Low
1.456B
Peer Group High
3 Years
% Rank:
--
-12.70B
Peer Group Low
18.00B
Peer Group High
6 Months
% Rank:
--
-3.509B
Peer Group Low
2.976B
Peer Group High
5 Years
% Rank:
--
-1.455B
Peer Group Low
49.86B
Peer Group High
YTD
% Rank:
--
-2.080B
Peer Group Low
2.002B
Peer Group High
10 Years
% Rank:
--
-1.866B
Peer Group Low
81.23B
Peer Group High
Date Unavailable
Risk
Performance Versus Peer Group
Annual Total Returns Versus Peers
As of May 23, 2026.
Asset Allocation
As of March 31, 2026.
| Type | % Net |
|---|---|
| Cash | 2.13% |
| Stock | 1.25% |
| Bond | 101.1% |
| Convertible | 0.00% |
| Preferred | 0.00% |
| Other | -4.45% |
Top 10 Holdings
| Name | % Weight | Price | % Change |
|---|---|---|---|
|
Bonterra LLC FRN 05-Mar-2032
|
2.36% | -- | -- |
|
Capital Group Central Cash Fund; Class M
|
2.22% | -- | -- |
|
Med-Metrix LLC FRN 21-Jul-2032
|
1.96% | -- | -- |
|
Clarience Technologies LLC FRN 13-Feb-2032
|
1.94% | -- | -- |
|
West Star Aviation Inc FRN 20-May-2032
|
1.85% | -- | -- |
|
PCI Pharma Services Inc FRN 15-Oct-2032
|
1.76% | -- | -- |
| United States of America USGB 4.625 11/15/2055 FIX USD Government | 1.72% | 93.20 | 0.35% |
|
Tropicana Products Inc FRN 24-Jan-2029
|
1.55% | -- | -- |
|
Fortna Group Inc FRN 01-Jun-2029
|
1.50% | -- | -- |
|
Homrich & Berg Inc FRN 17-Nov-2031
|
1.45% | -- | -- |
Fees & Availability
| Fees | |
| Actual 12B-1 Fee | -- |
| Actual Management Fee | 0.31% |
| Administration Fee | 6.00K% |
| Maximum Front Load | -- |
| Maximum Deferred Load | -- |
| Maximum Redemption Fee | -- |
| General Availability | |
| Available for Insurance Product | No |
| Available for RRSP | No |
| Purchase Details | |
| Open to New Investors |
|
| Minimum Initial Investment | 1000.00 None |
| Minimum Subsequent Investment | 50.00 None |
Basic Info
| Investment Strategy | |
| The Fund seeks to provide a high level of current income and seek maximum total return, consistent with preservation of capital by investing in both publicly traded fixed income securities and private credit loans and securities, which include private corporate direct lending and asset-based finance investments. |
| General | |
| Security Type | Unlisted Closed-End Fund |
| Equity Style | -- |
| Broad Asset Class | Taxable Bond |
| Broad Category | Fixed Income |
| Global Peer Group | Bond USD |
| Peer Group | General Bond Funds |
| Global Macro | Bond HC |
| US Macro | General Domestic Taxable Fixed Income Funds |
| YCharts Categorization | -- |
| YCharts Benchmark | -- |
| Prospectus Objective | General Bond Funds |
| Fund Owner Firm Name | Capital Group/American Funds |
| Broad Asset Class Benchmark Index | |
| ^BBUSATR | 100.0% |
Fundamentals
| General | |
| Distribution Yield | -- |
| Dividend Yield TTM (5-21-26) | 6.36% |
| 30-Day SEC Yield (4-30-26) | 5.58% |
| 7-Day SEC Yield | -- |
| Number of Holdings | 740 |
| Bond | |
| Yield to Maturity (3-31-26) | 5.62% |
| Effective Duration | 5.20 |
| Average Coupon | 5.87% |
| Calculated Average Quality | 3.710 |
| Effective Maturity | 11.85 |
| Nominal Maturity | 11.90 |
| Number of Bond Holdings | 619 |
As of March 31, 2026
Fund Details
Top Portfolio Holders
| Name | % Weight |
|---|---|
| Portfolio A | 5.00% |
| Portfolio B | 3.50% |
| Portfolio C | 2.25% |