

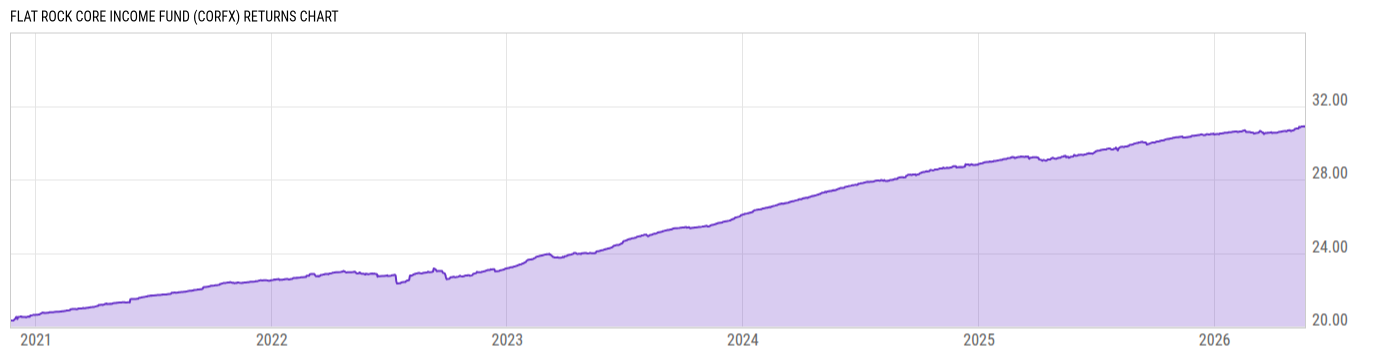
Flat Rock Core Income Fund (CORFX)
19.21
0.00 (0.00%)
USD |
Jun 10 2026
Returns Chart
Key Stats
| Net Expense Ratio | Total Assets Under Management | Weighted Average Dividend Yield | Turnover Ratio (Generic) |
|---|---|---|---|
| 5.01% | 295.48M | -- | 32.00% |
| 1 Year Fund Level Flows | 1 Year Total Returns (Daily) | Annualized Total Returns Since Inception (Daily) | Max Drawdown (Since Inception) |
| -- | 5.48% |
Basic Info
| Investment Strategy | |
| The Fund seeks preservation of capital while generating current income from its debt investments and seeking to maximize the portfolios total return. The Fund normally invests in a portfolio composed primarily of senior secured loans of U.S. middle-market companies (Senior Loans) and investment vehicles. |
| General | |
| Security Type | Unlisted Closed-End Fund |
| Equity Style | -- |
| Broad Asset Class | Taxable Bond |
| Broad Category | Fixed Income |
| Global Peer Group | Loan Participation Funds |
| Peer Group | Loan Participation Funds |
| Global Macro | Loan Participation Funds |
| US Macro | General Domestic Taxable Fixed Income Funds |
| YCharts Categorization | -- |
| YCharts Benchmark | -- |
| Prospectus Objective | Loan Participation Funds |
| Fund Owner Firm Name | Flat Rock Global |
| Broad Asset Class Benchmark Index | |
| ^BBUSATR | 100.0% |
Net Fund Flows Versus Peer Group
1 Month
% Rank:
--
-120.38M
Peer Group Low
1.130B
Peer Group High
1 Year
% Rank:
--
-1.857B
Peer Group Low
6.524B
Peer Group High
3 Months
% Rank:
--
-902.22M
Peer Group Low
2.516B
Peer Group High
3 Years
% Rank:
--
-2.611B
Peer Group Low
21.94B
Peer Group High
6 Months
% Rank:
--
-1.596B
Peer Group Low
4.432B
Peer Group High
5 Years
% Rank:
--
-4.547B
Peer Group Low
24.56B
Peer Group High
YTD
% Rank:
--
-1.334B
Peer Group Low
3.795B
Peer Group High
10 Years
% Rank:
--
-10.87B
Peer Group Low
25.40B
Peer Group High
Date Unavailable
Risk
Performance Versus Peer Group
Annual Total Returns Versus Peers
As of June 11, 2026.
Asset Allocation
As of December 31, 2025.
| Type | % Net |
|---|---|
| Cash | 1.14% |
| Stock | 4.33% |
| Bond | 108.5% |
| Convertible | 0.00% |
| Preferred | 0.00% |
| Other | -13.94% |
Top 10 Holdings
| Name | % Weight | Price | % Change |
|---|---|---|---|
|
Hercules Private Global Venture Growth Fund I LP
|
6.05% | -- | -- |
|
Triplepoint Private Venture Credit Inc ORD
|
4.33% | -- | -- |
|
Bcp Great Lakes Fund II
|
3.37% | -- | -- |
|
FORTRESS CREDIT OPPORTUNITIES CLO LIMITED 21R ER SEQ FLT 11.57549% 21-JAN-2037
|
3.28% | -- | -- |
|
New Mountain Guardian IV Feeder III Ltd FRN
|
3.19% | -- | -- |
|
Monroe Capital Abs Funding II LP FRN 07-Jan-2036
|
3.00% | -- | -- |
|
Vehicle Management Services LLC FRN 26-Jul-2027
|
2.71% | -- | -- |
|
PTSH Intermediate Holdings LLC FRN 17-Dec-2027
|
2.56% | -- | -- |
|
Amerit Fleet Parent LLC FRN 27-Jan-2032
|
2.55% | -- | -- |
|
Xenon Arc Inc FRN 20-Dec-2028
|
2.55% | -- | -- |
Fees & Availability
| Fees | |
| Actual 12B-1 Fee | -- |
| Actual Management Fee | 1.38% |
| Administration Fee | 283.1K% |
| Maximum Front Load | -- |
| Maximum Deferred Load | -- |
| Maximum Redemption Fee | -- |
| General Availability | |
| Available for Insurance Product | No |
| Available for RRSP | No |
| Purchase Details | |
| Open to New Investors |
|
| Minimum Initial Investment | 1000.00 None |
| Minimum Subsequent Investment | 1000.00 None |
Basic Info
| Investment Strategy | |
| The Fund seeks preservation of capital while generating current income from its debt investments and seeking to maximize the portfolios total return. The Fund normally invests in a portfolio composed primarily of senior secured loans of U.S. middle-market companies (Senior Loans) and investment vehicles. |
| General | |
| Security Type | Unlisted Closed-End Fund |
| Equity Style | -- |
| Broad Asset Class | Taxable Bond |
| Broad Category | Fixed Income |
| Global Peer Group | Loan Participation Funds |
| Peer Group | Loan Participation Funds |
| Global Macro | Loan Participation Funds |
| US Macro | General Domestic Taxable Fixed Income Funds |
| YCharts Categorization | -- |
| YCharts Benchmark | -- |
| Prospectus Objective | Loan Participation Funds |
| Fund Owner Firm Name | Flat Rock Global |
| Broad Asset Class Benchmark Index | |
| ^BBUSATR | 100.0% |
Fundamentals
| General | |
| Distribution Yield | -- |
| Dividend Yield TTM (6-10-26) | 9.86% |
| 30-Day SEC Yield | -- |
| 7-Day SEC Yield | -- |
| Number of Holdings | 80 |
| Bond | |
| Yield to Maturity (12-31-25) | 9.82% |
| Effective Duration | -- |
| Average Coupon | 11.43% |
| Calculated Average Quality | 5.076 |
| Effective Maturity | 6.304 |
| Nominal Maturity | 6.304 |
| Number of Bond Holdings | 73 |
As of December 31, 2025
Fund Details
| Key Dates | |
| Launch Date | 11/23/2020 |
| Last Annual Report Date | 12/31/2025 |
| Last Prospectus Date | 4/28/2025 |
| Attributes | |
| Index Fund | -- |
| Inverse Fund | No |
| Leveraged Fund |
|
| Fund of Funds | No |
| Currency Hedged Fund | -- |
| Socially Responsible Fund | No |
Top Portfolio Holders
| Name | % Weight |
|---|---|
| Portfolio A | 5.00% |
| Portfolio B | 3.50% |
| Portfolio C | 2.25% |