

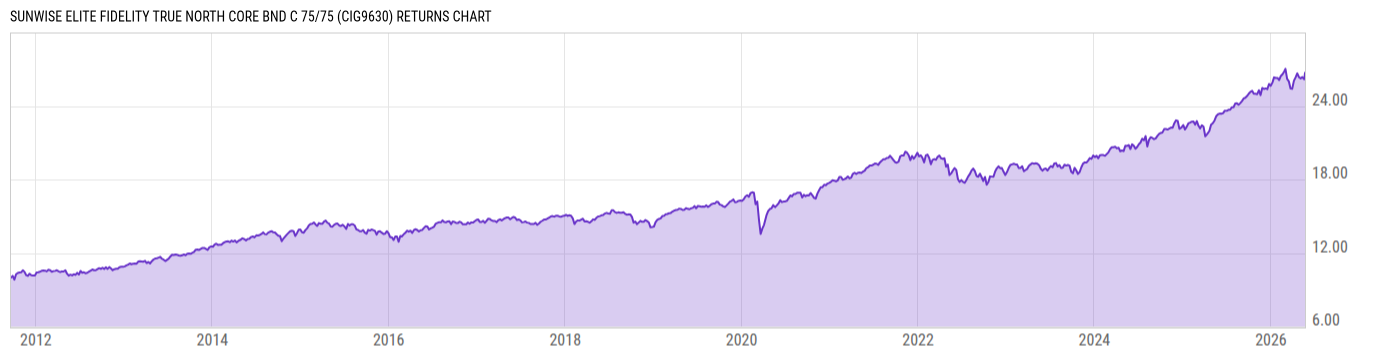
SunWise Elite Fidelity True North Core Bnd C 75/75 (CIG9630)
26.71
+0.04
(+0.15%)
CAD |
May 22 2026
Returns Chart
Key Stats
| Net Expense Ratio | Total Assets Under Management | Weighted Average Dividend Yield | Turnover Ratio (Generic) |
|---|---|---|---|
| 3.16% | 5.594M | -- | 23.34% |
| 1 Year Fund Level Flows | 1 Year Total Returns (Daily) | Annualized Total Returns Since Inception (Daily) | Max Drawdown (Since Inception) |
| -701789.0 | 16.09% |
Basic Info
| Investment Strategy | |
| This fund invests in Fidelity True North Fund and Fidelity Canadian Bond Fund. The underlying Funds are combined to hold about 70% in shares and 30% in bonds. No new contributions will be accepted. |
| General | |
| Security Type | Insurance Fund |
| Equity Style | -- |
| Broad Asset Class | International Equity |
| Broad Category | Allocation |
| Global Peer Group | Mixed Asset CAD Aggressive - Canada |
| Peer Group | Canadian Equity Balanced |
| Global Macro | -- |
| US Macro | -- |
| YCharts Categorization | -- |
| YCharts Benchmark | -- |
| Prospectus Objective | -- |
| Fund Owner Firm Name | CI Global Asset Management |
| Broad Asset Class Benchmark Index | |
| ^SPTSX60TR | 100.0% |
Net Fund Flows Versus Peer Group
1 Month
% Rank:
23
-181.24M
Peer Group Low
17.16M
Peer Group High
1 Year
% Rank:
26
-701789.0
-1.470B
Peer Group Low
868.15M
Peer Group High
3 Months
% Rank:
22
-680.11M
Peer Group Low
76.42M
Peer Group High
3 Years
% Rank:
18
-2.290B
Peer Group Low
2.115B
Peer Group High
6 Months
% Rank:
30
-1.067B
Peer Group Low
271.60M
Peer Group High
5 Years
% Rank:
23
-3.771B
Peer Group Low
2.248B
Peer Group High
YTD
% Rank:
26
-922.42M
Peer Group Low
58.28M
Peer Group High
10 Years
% Rank:
29
-11.72B
Peer Group Low
2.266B
Peer Group High
Date Unavailable
Risk
Performance Versus Peer Group
Annual Total Returns Versus Peers
As of May 24, 2026.
Asset Allocation
As of April 30, 2026.
| Type | % Net |
|---|---|
| Cash | 1.52% |
| Stock | 67.44% |
| Bond | 28.60% |
| Convertible | 0.00% |
| Preferred | 0.73% |
| Other | 1.71% |
Top 4 Holdings
| Name | % Weight | Price | % Change |
|---|---|---|---|
| Fidelity True North Series O | 71.81% | 86.59 | 0.22% |
| Fidelity Canadian Bond Series O | 27.83% | 13.11 | 0.01% |
|
CAD CASH
|
0.55% | -- | -- |
|
OTHER ASSETS LESS LIABILITIES
|
-0.19% | -- | -- |
Fees & Availability
| Fees | |
| Actual 12B-1 Fee | -- |
| Actual Management Fee | -- |
| Administration Fee | -- |
| Maximum Front Load | -- |
| Maximum Deferred Load | -- |
| Maximum Redemption Fee | -- |
| General Availability | |
| Available for Insurance Product |
|
| Available for RRSP |
|
| Purchase Details | |
| Open to New Investors |
|
| Minimum Initial Investment | 500.00 None |
| Minimum Subsequent Investment | 50.00 None |
Basic Info
| Investment Strategy | |
| This fund invests in Fidelity True North Fund and Fidelity Canadian Bond Fund. The underlying Funds are combined to hold about 70% in shares and 30% in bonds. No new contributions will be accepted. |
| General | |
| Security Type | Insurance Fund |
| Equity Style | -- |
| Broad Asset Class | International Equity |
| Broad Category | Allocation |
| Global Peer Group | Mixed Asset CAD Aggressive - Canada |
| Peer Group | Canadian Equity Balanced |
| Global Macro | -- |
| US Macro | -- |
| YCharts Categorization | -- |
| YCharts Benchmark | -- |
| Prospectus Objective | -- |
| Fund Owner Firm Name | CI Global Asset Management |
| Broad Asset Class Benchmark Index | |
| ^SPTSX60TR | 100.0% |
Fundamentals
| General | |
| Distribution Yield | -- |
| Dividend Yield TTM (5-22-26) | 0.00% |
| 30-Day SEC Yield | -- |
| 7-Day SEC Yield | -- |
| Number of Holdings | 4 |
| Stock | |
| Weighted Average PE Ratio | 26.74 |
| Weighted Average Price to Sales Ratio | 5.665 |
| Weighted Average Price to Book Ratio | 4.184 |
| Weighted Median ROE | 15.69% |
| Weighted Median ROA | 5.90% |
| ROI (TTM) | 9.86% |
| Return on Investment (TTM) | 9.86% |
| Earning Yield | 0.0533 |
| LT Debt / Shareholders Equity | 0.6834 |
| Number of Equity Holdings | 0 |
| Bond | |
| Yield to Maturity (4-30-26) | 4.01% |
| Effective Duration | -- |
| Average Coupon | 3.79% |
| Calculated Average Quality | 2.256 |
| Effective Maturity | 10.86 |
| Nominal Maturity | 11.24 |
| Number of Bond Holdings | 0 |
As of April 30, 2026
Growth Metrics
| EPS Growth (1Y) | 34.29% |
| EPS Growth (3Y) | 16.64% |
| EPS Growth (5Y) | 15.96% |
| Sales Growth (1Y) | 15.08% |
| Sales Growth (3Y) | 9.91% |
| Sales Growth (5Y) | 13.17% |
| Sales per Share Growth (1Y) | 15.98% |
| Sales per Share Growth (3Y) | 9.55% |
| Operating Cash Flow - Growth Rate (3Y) | 31.80% |
As of April 30, 2026
Fund Details
Top Portfolio Holders
| Name | % Weight |
|---|---|
| Portfolio A | 5.00% |
| Portfolio B | 3.50% |
| Portfolio C | 2.25% |