

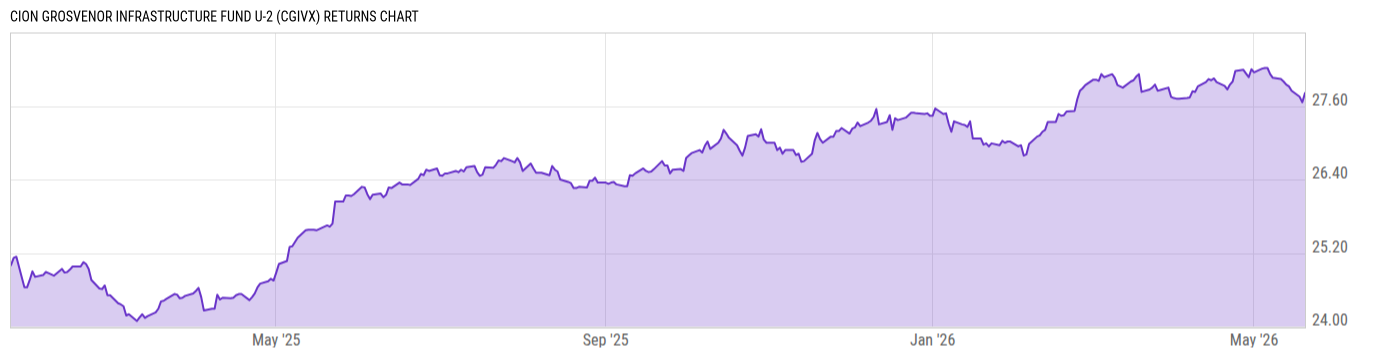
CION Grosvenor Infrastructure Fund U-2 (CGIVX)
27.37
-0.06
(-0.22%)
USD |
Jun 10 2026
Returns Chart
Key Stats
| Net Expense Ratio | Total Assets Under Management | Weighted Average Dividend Yield | Turnover Ratio (Generic) |
|---|---|---|---|
| 3.99% | 109.15M | -- | -- |
| 1 Year Fund Level Flows | 1 Year Total Returns (Daily) | Annualized Total Returns Since Inception (Daily) | Max Drawdown (Since Inception) |
| -- | 4.83% |
Basic Info
| Investment Strategy | |
| The Fund seeks to provide current income and long-term capital appreciation by generating attractive risk-adjusted returns and current income through direct and indirect investments in Infrastructure Assets. Investments in Infrastructure Assets wil be made in the OECD countries, principally in North America and Europe. |
| General | |
| Security Type | Unlisted Closed-End Fund |
| Equity Style | -- |
| Broad Asset Class | Sector Equity |
| Broad Category | Equity |
| Global Peer Group | Equity Other |
| Peer Group | Sector Equity Funds |
| Global Macro | Equity Other |
| US Macro | -- |
| YCharts Categorization | -- |
| YCharts Benchmark | -- |
| Prospectus Objective | Sector Equity Funds |
| Fund Owner Firm Name | CION Investments |
| Broad Asset Class Benchmark Index | |
| ^MSWNTR | 100.0% |
Net Fund Flows Versus Peer Group
1 Month
% Rank:
--
157.11M
Peer Group Low
157.11M
Peer Group High
1 Year
% Rank:
--
2.180B
Peer Group Low
2.180B
Peer Group High
3 Months
% Rank:
--
495.40M
Peer Group Low
495.40M
Peer Group High
3 Years
% Rank:
--
3.823B
Peer Group Low
3.823B
Peer Group High
6 Months
% Rank:
--
1.045B
Peer Group Low
1.045B
Peer Group High
5 Years
% Rank:
--
--
Peer Group Low
--
Peer Group High
YTD
% Rank:
--
616.64M
Peer Group Low
616.64M
Peer Group High
10 Years
% Rank:
--
--
Peer Group Low
--
Peer Group High
Date Unavailable
Risk
Performance Versus Peer Group
Annual Total Returns Versus Peers
As of June 11, 2026.
Asset Allocation
As of December 31, 2025.
| Type | % Net |
|---|---|
| Cash | 3.93% |
| Stock | 63.26% |
| Bond | 16.42% |
| Convertible | 0.00% |
| Preferred | 0.00% |
| Other | 16.39% |
Top 10 Holdings
| Name | % Weight | Price | % Change |
|---|---|---|---|
|
Volt Parent LP
|
13.24% | -- | -- |
|
Edge Orbital Holdings Ltd FRN 31-Mar-2033
|
6.95% | -- | -- |
|
University College London Hospital 10.250% 31-Mar-2040
|
4.88% | -- | -- |
|
DB Dino Holdings I LP
|
4.73% | -- | -- |
|
Riverstone Iris Continuation Fund LP
|
3.89% | -- | -- |
| Northern Treasury Portfolio Shares | 3.78% | 1.00 | 0.00% |
|
University College London Hospital
|
3.65% | -- | -- |
| BNY Dreyfus Treasury Obligations Cash Mgmt Inst | 2.94% | 1.00 | 0.00% |
|
Vantage Airport Group (New York) LLC
|
2.85% | -- | -- |
|
Infraeuropa Co-Invest Sca
|
2.56% | -- | -- |
Fees & Availability
| Fees | |
| Actual 12B-1 Fee | 0.75% |
| Actual Management Fee | 1.60% |
| Administration Fee | -- |
| Maximum Front Load | 2.50% |
| Maximum Deferred Load | -- |
| Maximum Redemption Fee | -- |
| General Availability | |
| Available for Insurance Product | No |
| Available for RRSP | No |
| Purchase Details | |
| Open to New Investors |
|
| Minimum Initial Investment | 2500.00 None |
| Minimum Subsequent Investment | 100.00 None |
Basic Info
| Investment Strategy | |
| The Fund seeks to provide current income and long-term capital appreciation by generating attractive risk-adjusted returns and current income through direct and indirect investments in Infrastructure Assets. Investments in Infrastructure Assets wil be made in the OECD countries, principally in North America and Europe. |
| General | |
| Security Type | Unlisted Closed-End Fund |
| Equity Style | -- |
| Broad Asset Class | Sector Equity |
| Broad Category | Equity |
| Global Peer Group | Equity Other |
| Peer Group | Sector Equity Funds |
| Global Macro | Equity Other |
| US Macro | -- |
| YCharts Categorization | -- |
| YCharts Benchmark | -- |
| Prospectus Objective | Sector Equity Funds |
| Fund Owner Firm Name | CION Investments |
| Broad Asset Class Benchmark Index | |
| ^MSWNTR | 100.0% |
Fundamentals
| General | |
| Distribution Yield | -- |
| Dividend Yield TTM (6-10-26) | 0.00% |
| 30-Day SEC Yield | -- |
| 7-Day SEC Yield | -- |
| Number of Holdings | 59 |
| Stock | |
| Weighted Average PE Ratio | -- |
| Weighted Average Price to Sales Ratio | -- |
| Weighted Average Price to Book Ratio | -- |
| Weighted Median ROE | -- |
| Weighted Median ROA | -- |
| ROI (TTM) | -- |
| Return on Investment (TTM) | -- |
| Earning Yield | -- |
| LT Debt / Shareholders Equity | -- |
| Number of Equity Holdings | 33 |
| Bond | |
| Yield to Maturity (12-31-25) | -- |
| Effective Duration | -- |
| Average Coupon | -- |
| Calculated Average Quality | -- |
| Effective Maturity | -- |
| Nominal Maturity | -- |
| Number of Bond Holdings | 3 |
As of December 31, 2025
Growth Metrics
| EPS Growth (1Y) | -- |
| EPS Growth (3Y) | -- |
| EPS Growth (5Y) | -- |
| Sales Growth (1Y) | -- |
| Sales Growth (3Y) | -- |
| Sales Growth (5Y) | -- |
| Sales per Share Growth (1Y) | -- |
| Sales per Share Growth (3Y) | -- |
| Operating Cash Flow - Growth Rate (3Y) | -- |
As of December 31, 2025
Top Portfolio Holders
| Name | % Weight |
|---|---|
| Portfolio A | 5.00% |
| Portfolio B | 3.50% |
| Portfolio C | 2.25% |