

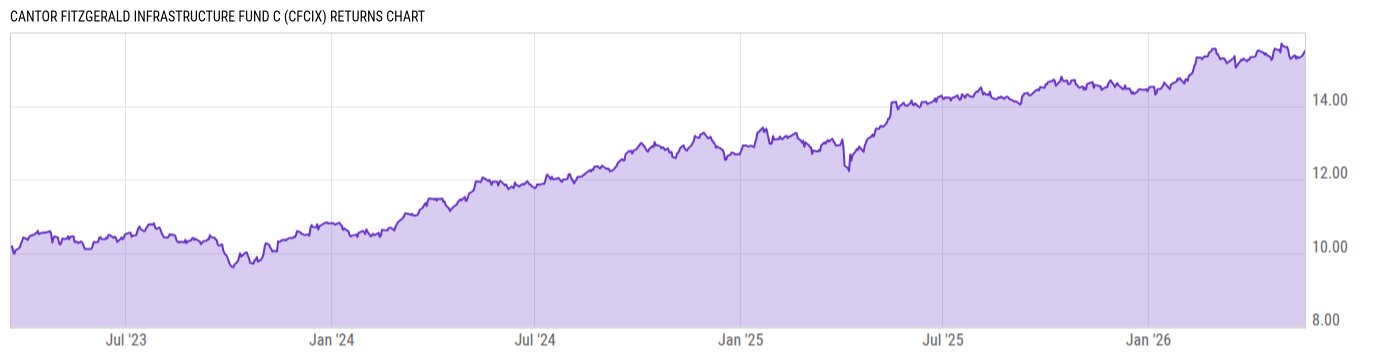
Cantor Fitzgerald Infrastructure Fund C (CFCIX)
13.78
+0.05
(+0.36%)
USD |
May 21 2026
Returns Chart
Key Stats
| Net Expense Ratio | Total Assets Under Management | Weighted Average Dividend Yield | Turnover Ratio (Generic) |
|---|---|---|---|
| 3.25% | 685.65M | 2.32% | 1.00% |
| 1 Year Fund Level Flows | 1 Year Total Returns (Daily) | Annualized Total Returns Since Inception (Daily) | Max Drawdown (Since Inception) |
| -- | 10.97% |
Basic Info
| Investment Strategy | |
| The Fund seeks to maximize total return, with an emphasis on current income, while seeking to invest in issuers that are helping to address certain United Nations Sustainable Development Goals through their products and services. The Fund invests in securities issued by sustainable infrastructure companies. |
| General | |
| Security Type | Unlisted Closed-End Fund |
| Equity Style | Multi Cap Value |
| Broad Asset Class | International Equity |
| Broad Category | Equity |
| Global Peer Group | Equity Global |
| Peer Group | Global Funds |
| Global Macro | Equity Global |
| US Macro | Developed Global Markets Funds |
| YCharts Categorization | -- |
| YCharts Benchmark | -- |
| Prospectus Objective | Global Funds |
| Fund Owner Firm Name | Cantor Fitzgerald |
| Broad Asset Class Benchmark Index | |
| ^MSACXUSNTR | 100.0% |
Net Fund Flows Versus Peer Group
1 Month
% Rank:
--
53.74M
Peer Group Low
53.74M
Peer Group High
1 Year
% Rank:
--
--
Peer Group Low
--
Peer Group High
3 Months
% Rank:
--
73.10M
Peer Group Low
73.10M
Peer Group High
3 Years
% Rank:
--
--
Peer Group Low
--
Peer Group High
6 Months
% Rank:
--
183.87M
Peer Group Low
183.87M
Peer Group High
5 Years
% Rank:
--
--
Peer Group Low
--
Peer Group High
YTD
% Rank:
--
69.29M
Peer Group Low
69.29M
Peer Group High
10 Years
% Rank:
--
--
Peer Group Low
--
Peer Group High
Date Unavailable
Risk
Performance Versus Peer Group
Annual Total Returns Versus Peers
As of May 22, 2026.
Asset Allocation
As of March 31, 2026.
| Type | % Net |
|---|---|
| Cash | 2.17% |
| Stock | 75.83% |
| Bond | 1.70% |
| Convertible | 0.00% |
| Preferred | 0.00% |
| Other | 20.30% |
Top 10 Holdings
| Name | % Weight | Price | % Change |
|---|---|---|---|
|
CFIIX Holdings I LLC
|
8.69% | -- | -- |
|
Blackstone Infrastructure Partners LP
|
5.98% | -- | -- |
|
CFIIX International Holdings Ltd
|
5.90% | -- | -- |
|
DigitalBridge AI Infrastructure B LP
|
4.74% | -- | -- |
| The Williams Cos., Inc. | 4.31% | 78.49 | 1.25% |
| SLB Ltd. | 3.96% | 57.76 | 0.89% |
| Morgan Stanley Inst Liq Govt Port Institutional | 3.87% | 1.00 | 0.00% |
| NextEra Energy, Inc. | 3.21% | 88.67 | -1.14% |
| Vistra Corp. | 2.66% | 156.61 | 5.05% |
|
Tomcat US Co Invest LP
|
2.62% | -- | -- |
Fees & Availability
| Fees | |
| Actual 12B-1 Fee | 0.75% |
| Actual Management Fee | 0.01% |
| Administration Fee | 2.55K% |
| Maximum Front Load | -- |
| Maximum Deferred Load | 1.00% |
| Maximum Redemption Fee | -- |
| General Availability | |
| Available for Insurance Product | No |
| Available for RRSP | No |
| Purchase Details | |
| Open to New Investors |
|
| Minimum Initial Investment | 2500.00 None |
| Minimum Subsequent Investment | 100.00 None |
Basic Info
| Investment Strategy | |
| The Fund seeks to maximize total return, with an emphasis on current income, while seeking to invest in issuers that are helping to address certain United Nations Sustainable Development Goals through their products and services. The Fund invests in securities issued by sustainable infrastructure companies. |
| General | |
| Security Type | Unlisted Closed-End Fund |
| Equity Style | Multi Cap Value |
| Broad Asset Class | International Equity |
| Broad Category | Equity |
| Global Peer Group | Equity Global |
| Peer Group | Global Funds |
| Global Macro | Equity Global |
| US Macro | Developed Global Markets Funds |
| YCharts Categorization | -- |
| YCharts Benchmark | -- |
| Prospectus Objective | Global Funds |
| Fund Owner Firm Name | Cantor Fitzgerald |
| Broad Asset Class Benchmark Index | |
| ^MSACXUSNTR | 100.0% |
Fundamentals
| General | |
| Distribution Yield | -- |
| Dividend Yield TTM (5-20-26) | 3.84% |
| 30-Day SEC Yield | -- |
| 7-Day SEC Yield | -- |
| Number of Holdings | 70 |
| Stock | |
| Weighted Average PE Ratio | 29.22 |
| Weighted Average Price to Sales Ratio | 4.740 |
| Weighted Average Price to Book Ratio | 5.757 |
| Weighted Median ROE | 16.31% |
| Weighted Median ROA | 4.94% |
| ROI (TTM) | 5.95% |
| Return on Investment (TTM) | 5.95% |
| Earning Yield | 0.0407 |
| LT Debt / Shareholders Equity | 1.244 |
| Number of Equity Holdings | 58 |
As of March 31, 2026
Growth Metrics
| EPS Growth (1Y) | 9.94% |
| EPS Growth (3Y) | 16.76% |
| EPS Growth (5Y) | 22.81% |
| Sales Growth (1Y) | 10.82% |
| Sales Growth (3Y) | 2.90% |
| Sales Growth (5Y) | 10.39% |
| Sales per Share Growth (1Y) | 9.41% |
| Sales per Share Growth (3Y) | 2.04% |
| Operating Cash Flow - Growth Rate (3Y) | 33.45% |
As of March 31, 2026
Fund Details
Top Portfolio Holders
| Name | % Weight |
|---|---|
| Portfolio A | 5.00% |
| Portfolio B | 3.50% |
| Portfolio C | 2.25% |