

Cantor Fitzgerald Commodity Return Strategy Ptf 1 (CCRSX)
21.69
-0.32
(-1.45%)
USD |
Jun 09 2026
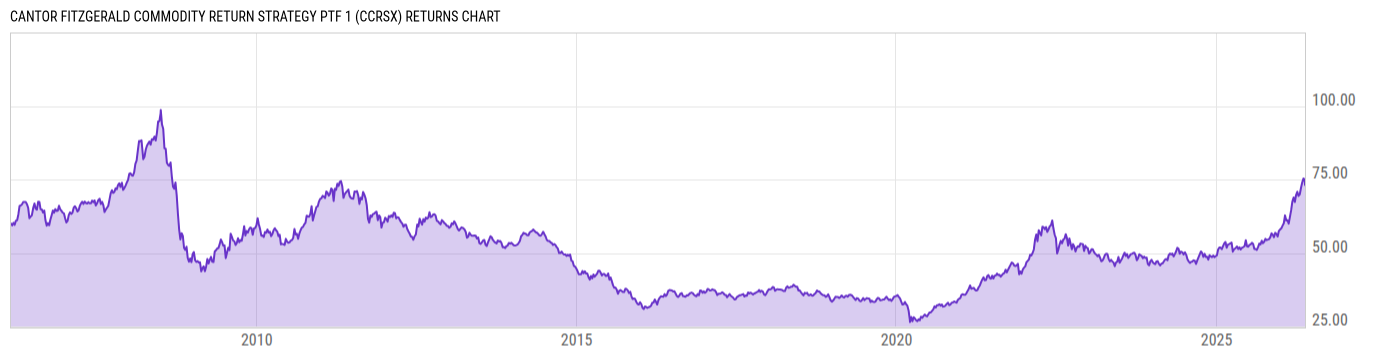
Returns Chart
Key Stats
| Net Expense Ratio | Total Assets Under Management | Weighted Average Dividend Yield | Turnover Ratio (Generic) |
|---|---|---|---|
| 1.04% | 771.67M | -- | 56.00% |
| 1 Year Fund Level Flows | 1 Year Total Returns (Daily) | Annualized Total Returns Since Inception (Daily) | Max Drawdown (Since Inception) |
| -63.14M | 31.52% |
Basic Info
| Investment Strategy | |
| The Fund seeks total return. To pursue this goal, the Fund invests in commodity-linked derivative instruments backed by a portfolio of fixed-income securities. |
| General | |
| Security Type | Insurance Fund |
| Equity Style | -- |
| Broad Asset Class | Commodities |
| Broad Category | Real Assets |
| Global Peer Group | Commodity Blended |
| Peer Group | Commodities General Funds |
| Global Macro | Commodity Blended |
| US Macro | Commodities Funds |
| YCharts Categorization | -- |
| YCharts Benchmark | -- |
| Prospectus Objective | Commodities Funds |
| Fund Owner Firm Name | UBS Asset Management |
| Broad Asset Class Benchmark Index | |
| ^BCTR | 100.0% |
Net Fund Flows Versus Peer Group
1 Month
% Rank:
74
-267.38M
Peer Group Low
225.86M
Peer Group High
1 Year
% Rank:
63
-63.14M
-1.413B
Peer Group Low
2.317B
Peer Group High
3 Months
% Rank:
65
-424.27M
Peer Group Low
914.54M
Peer Group High
3 Years
% Rank:
45
-2.785B
Peer Group Low
2.546B
Peer Group High
6 Months
% Rank:
61
-1.287B
Peer Group Low
1.516B
Peer Group High
5 Years
% Rank:
54
-7.491B
Peer Group Low
2.625B
Peer Group High
YTD
% Rank:
68
-460.54M
Peer Group Low
1.296B
Peer Group High
10 Years
% Rank:
51
-4.281B
Peer Group Low
3.873B
Peer Group High
Date Unavailable
Risk
Performance Versus Peer Group
Annual Total Returns Versus Peers
As of June 10, 2026.
Asset Allocation
As of April 30, 2026.
| Type | % Net |
|---|---|
| Cash | 0.48% |
| Stock | 17.34% |
| Bond | 81.83% |
| Convertible | 0.00% |
| Preferred | 0.00% |
| Other | 0.35% |
Top 10 Holdings
| Name | % Weight | Price | % Change |
|---|---|---|---|
|
CREDIT SUISSE TRUST CAYMAN
|
17.34% | -- | -- |
| Royal Bank of Canada RY 09/16/2026 UNKNOWN USD Corporate | 6.34% | -- | -- |
| Bank of Montreal BMO 12/29/2026 FLT USD Corporate 144A | 5.59% | -- | -2.72% |
| United States of America USGB 07/31/2027 FLT USD Government | 5.26% | 100.16 | -0.05% |
| United States of America USGB 01/31/2028 FLT USD Government | 4.46% | 100.18 | -0.06% |
| United States of America USGB 01/31/2027 FLT USD Government | 4.43% | 100.01 | -0.02% |
|
United States of America (Government) 3.746245628% 30-APR-2028
|
2.87% | -- | -- |
| United States of America USGB 10/31/2026 FLT USD Government | 2.83% | 100.01 | -0.00% |
| United States of America USGB 04/30/2027 FLT USD Government | 2.63% | 100.13 | -0.03% |
| United States of America USGB 4.25 02/15/2028 FIX USD Government | 2.54% | 100.20 | 0.05% |
Fees & Availability
| Fees | |
| Actual 12B-1 Fee | 0.25% |
| Actual Management Fee | 0.55% |
| Administration Fee | 5.72K% |
| Maximum Front Load | -- |
| Maximum Deferred Load | -- |
| Maximum Redemption Fee | -- |
| General Availability | |
| Available for Insurance Product |
|
| Available for RRSP | No |
| Purchase Details | |
| Open to New Investors |
|
| Minimum Initial Investment | 0.00 None |
| Minimum Subsequent Investment | 0.00 None |
Basic Info
| Investment Strategy | |
| The Fund seeks total return. To pursue this goal, the Fund invests in commodity-linked derivative instruments backed by a portfolio of fixed-income securities. |
| General | |
| Security Type | Insurance Fund |
| Equity Style | -- |
| Broad Asset Class | Commodities |
| Broad Category | Real Assets |
| Global Peer Group | Commodity Blended |
| Peer Group | Commodities General Funds |
| Global Macro | Commodity Blended |
| US Macro | Commodities Funds |
| YCharts Categorization | -- |
| YCharts Benchmark | -- |
| Prospectus Objective | Commodities Funds |
| Fund Owner Firm Name | UBS Asset Management |
| Broad Asset Class Benchmark Index | |
| ^BCTR | 100.0% |
Fundamentals
| General | |
| Distribution Yield | -- |
| Dividend Yield TTM (6-8-26) | 11.26% |
| 30-Day SEC Yield | -- |
| 7-Day SEC Yield | -- |
| Number of Holdings | 55 |
| Stock | |
| Weighted Average PE Ratio | -- |
| Weighted Average Price to Sales Ratio | -- |
| Weighted Average Price to Book Ratio | -- |
| Weighted Median ROE | -- |
| Weighted Median ROA | -- |
| ROI (TTM) | -- |
| Return on Investment (TTM) | -- |
| Earning Yield | -- |
| LT Debt / Shareholders Equity | -- |
| Number of Equity Holdings | 1 |
| Bond | |
| Yield to Maturity (4-30-26) | 3.73% |
| Effective Duration | -- |
| Average Coupon | 3.85% |
| Calculated Average Quality | 2.00 |
| Effective Maturity | 1.178 |
| Nominal Maturity | 1.178 |
| Number of Bond Holdings | 50 |
As of April 30, 2026
Growth Metrics
| EPS Growth (1Y) | -- |
| EPS Growth (3Y) | -- |
| EPS Growth (5Y) | -- |
| Sales Growth (1Y) | -- |
| Sales Growth (3Y) | -- |
| Sales Growth (5Y) | -- |
| Sales per Share Growth (1Y) | -- |
| Sales per Share Growth (3Y) | -- |
| Operating Cash Flow - Growth Rate (3Y) | -- |
As of April 30, 2026
Fund Details
| Key Dates | |
| Launch Date | 2/28/2006 |
| Last Annual Report Date | 12/31/2025 |
| Last Prospectus Date | 4/1/2026 |
| Share Classes | |
| CCRRX | Other |
| Attributes | |
| Index Fund | -- |
| Inverse Fund | No |
| Leveraged Fund | -- |
| Fund of Funds | No |
| Currency Hedged Fund | -- |
| Socially Responsible Fund | No |
Top Portfolio Holders
| Name | % Weight |
|---|---|
| Portfolio A | 5.00% |
| Portfolio B | 3.50% |
| Portfolio C | 2.25% |