

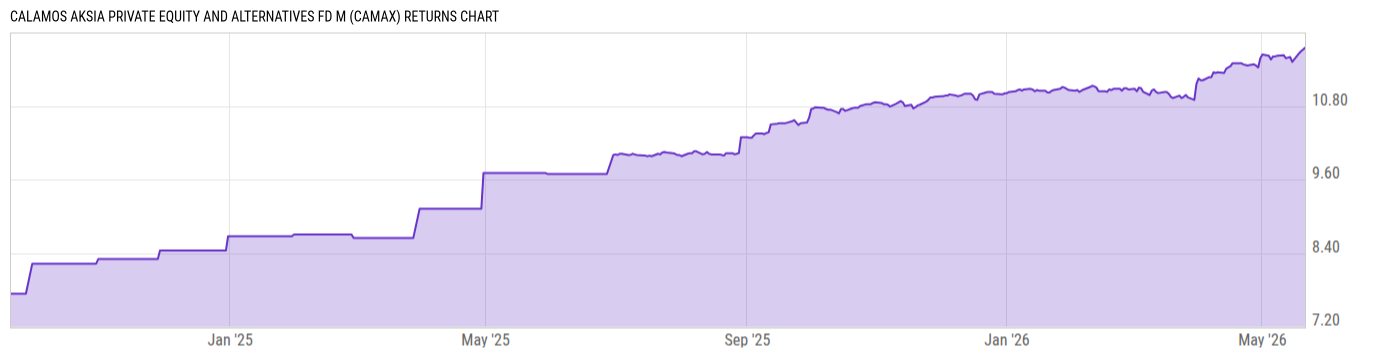
Calamos Aksia Private Equity and Alternatives Fd M (CAMAX)
11.75
+0.03
(+0.26%)
USD |
May 21 2026
Returns Chart
Key Stats
| Net Expense Ratio | Total Assets Under Management | Weighted Average Dividend Yield | Turnover Ratio (Generic) |
|---|---|---|---|
| 3.35% | 352.37M | -- | -- |
| 1 Year Fund Level Flows | 1 Year Total Returns (Daily) | Annualized Total Returns Since Inception (Daily) | Max Drawdown (Since Inception) |
| -- | 21.04% |
Basic Info
| Investment Strategy | |
| The Fund seeks to achieve long-term capital appreciation. The Fund invests primarily in Private Equity Investments which includes primary investments in private equity funds and Alternative Investments which are financial assets that do not fall into conventional investment categories like stocks, bonds and cash. |
| General | |
| Security Type | Unlisted Closed-End Fund |
| Equity Style | -- |
| Broad Asset Class | Sector Equity |
| Broad Category | Equity |
| Global Peer Group | Equity Other |
| Peer Group | Sector Equity Funds |
| Global Macro | Equity Other |
| US Macro | -- |
| YCharts Categorization | -- |
| YCharts Benchmark | -- |
| Prospectus Objective | Sector Equity Funds |
| Fund Owner Firm Name | Calamos |
| Broad Asset Class Benchmark Index | |
| ^MSWNTR | 100.0% |
Net Fund Flows Versus Peer Group
1 Month
% Rank:
--
184.54M
Peer Group Low
184.54M
Peer Group High
1 Year
% Rank:
--
2.188B
Peer Group Low
2.188B
Peer Group High
3 Months
% Rank:
--
459.53M
Peer Group Low
459.53M
Peer Group High
3 Years
% Rank:
--
3.666B
Peer Group Low
3.666B
Peer Group High
6 Months
% Rank:
--
1.039B
Peer Group Low
1.039B
Peer Group High
5 Years
% Rank:
--
--
Peer Group Low
--
Peer Group High
YTD
% Rank:
--
459.53M
Peer Group Low
459.53M
Peer Group High
10 Years
% Rank:
--
--
Peer Group Low
--
Peer Group High
Date Unavailable
Risk
Performance Versus Peer Group
Annual Total Returns Versus Peers
As of May 22, 2026.
Asset Allocation
As of December 31, 2025.
| Type | % Net |
|---|---|
| Cash | 11.37% |
| Stock | 54.97% |
| Bond | 4.58% |
| Convertible | 0.00% |
| Preferred | 0.00% |
| Other | 29.07% |
Top 10 Holdings
| Name | % Weight | Price | % Change |
|---|---|---|---|
|
USD Cash
|
11.37% | -- | -- |
|
mcp Opportunity Secondary Program V Feeder SLP
|
6.02% | -- | -- |
|
Overbay Capital Partners Inc
|
5.27% | -- | -- |
|
General Atlantic Investment Partners 2019 LP
|
5.22% | -- | -- |
|
WestCap Strategic Operator Fund II LP
|
4.21% | -- | -- |
|
Gen Atlantic Inv Part 2017
|
4.06% | -- | -- |
| United States of America USGB 0.0 07/09/2026 FIX USD Government | 3.06% | 99.52 | 0.00% |
|
Corsair Riva Munich Co Investment LP
|
2.98% | -- | -- |
|
Sima Holdings Offshore LP
|
2.68% | -- | -- |
|
LH Equity Investors LP
|
2.56% | -- | -- |
Fees & Availability
| Fees | |
| Actual 12B-1 Fee | 0.75% |
| Actual Management Fee | 0.75% |
| Administration Fee | -- |
| Maximum Front Load | -- |
| Maximum Deferred Load | -- |
| Maximum Redemption Fee | -- |
| General Availability | |
| Available for Insurance Product | No |
| Available for RRSP | No |
| Purchase Details | |
| Open to New Investors |
|
| Minimum Initial Investment | 10000.00 None |
| Minimum Subsequent Investment | 100.00 None |
Basic Info
| Investment Strategy | |
| The Fund seeks to achieve long-term capital appreciation. The Fund invests primarily in Private Equity Investments which includes primary investments in private equity funds and Alternative Investments which are financial assets that do not fall into conventional investment categories like stocks, bonds and cash. |
| General | |
| Security Type | Unlisted Closed-End Fund |
| Equity Style | -- |
| Broad Asset Class | Sector Equity |
| Broad Category | Equity |
| Global Peer Group | Equity Other |
| Peer Group | Sector Equity Funds |
| Global Macro | Equity Other |
| US Macro | -- |
| YCharts Categorization | -- |
| YCharts Benchmark | -- |
| Prospectus Objective | Sector Equity Funds |
| Fund Owner Firm Name | Calamos |
| Broad Asset Class Benchmark Index | |
| ^MSWNTR | 100.0% |
Fundamentals
| General | |
| Distribution Yield | -- |
| Dividend Yield TTM (5-20-26) | 0.00% |
| 30-Day SEC Yield | -- |
| 7-Day SEC Yield | -- |
| Number of Holdings | 52 |
| Stock | |
| Weighted Average PE Ratio | -- |
| Weighted Average Price to Sales Ratio | -- |
| Weighted Average Price to Book Ratio | -- |
| Weighted Median ROE | -- |
| Weighted Median ROA | -- |
| ROI (TTM) | -- |
| Return on Investment (TTM) | -- |
| Earning Yield | -- |
| LT Debt / Shareholders Equity | -- |
| Number of Equity Holdings | 30 |
| Bond | |
| Yield to Maturity (12-31-25) | -- |
| Effective Duration | -- |
| Average Coupon | -- |
| Calculated Average Quality | -- |
| Effective Maturity | -- |
| Nominal Maturity | -- |
| Number of Bond Holdings | 2 |
As of December 31, 2025
Growth Metrics
| EPS Growth (1Y) | -- |
| EPS Growth (3Y) | -- |
| EPS Growth (5Y) | -- |
| Sales Growth (1Y) | -- |
| Sales Growth (3Y) | -- |
| Sales Growth (5Y) | -- |
| Sales per Share Growth (1Y) | -- |
| Sales per Share Growth (3Y) | -- |
| Operating Cash Flow - Growth Rate (3Y) | -- |
As of December 31, 2025
Top Portfolio Holders
| Name | % Weight |
|---|---|
| Portfolio A | 5.00% |
| Portfolio B | 3.50% |
| Portfolio C | 2.25% |