

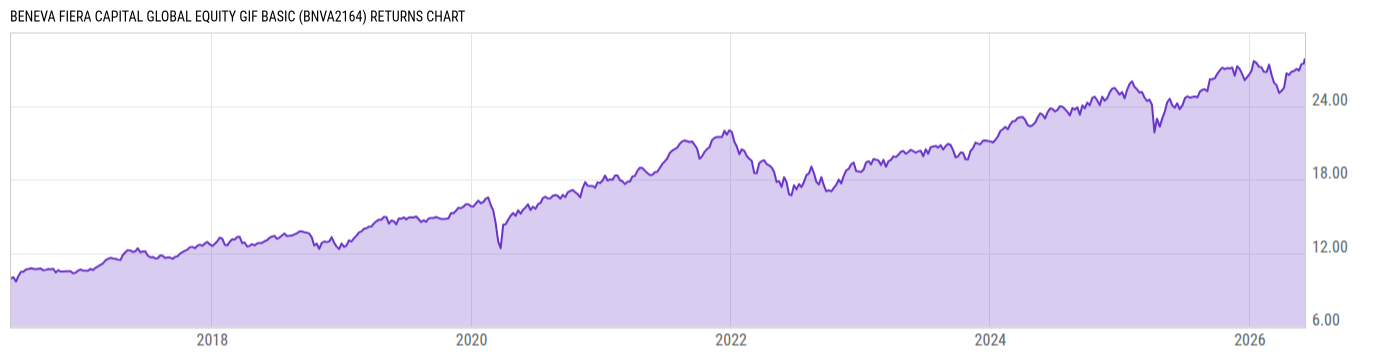
Beneva Fiera Capital Global Equity GIF Basic (BNVA2164)
27.55
-0.26
(-0.95%)
CAD |
Jun 05 2026
Returns Chart
Key Stats
| Net Expense Ratio | Total Assets Under Management | Weighted Average Dividend Yield | Turnover Ratio (Generic) |
|---|---|---|---|
| 3.58% | 54.23M | -- | -- |
| 1 Year Fund Level Flows | 1 Year Total Returns (Daily) | Annualized Total Returns Since Inception (Daily) | Max Drawdown (Since Inception) |
| -3.352M | 15.48% |
Basic Info
| Investment Strategy | |
| The fundamental investment objective of this fund is to generate long-term capital growth. The fund is invested mainly in the equities of large-cap global companies located outside of Canada. The fund may hold fund units corresponding to the previously mentioned securities. |
| General | |
| Security Type | Insurance Fund |
| Equity Style | -- |
| Broad Asset Class | International Equity |
| Broad Category | Equity |
| Global Peer Group | Equity Global |
| Peer Group | Global Equity |
| Global Macro | Equity Global |
| US Macro | -- |
| YCharts Categorization | -- |
| YCharts Benchmark | -- |
| Prospectus Objective | -- |
| Fund Owner Firm Name | Beneva |
| Broad Asset Class Benchmark Index | |
| ^SPTSX60TR | 100.0% |
Net Fund Flows Versus Peer Group
1 Month
% Rank:
54
-275.61M
Peer Group Low
874.30M
Peer Group High
1 Year
% Rank:
58
-3.352M
-3.677B
Peer Group Low
7.642B
Peer Group High
3 Months
% Rank:
61
-1.164B
Peer Group Low
2.508B
Peer Group High
3 Years
% Rank:
59
-8.516B
Peer Group Low
12.52B
Peer Group High
6 Months
% Rank:
70
-1.666B
Peer Group Low
4.973B
Peer Group High
5 Years
% Rank:
58
-7.301B
Peer Group Low
13.73B
Peer Group High
YTD
% Rank:
61
-1.790B
Peer Group Low
4.456B
Peer Group High
10 Years
% Rank:
63
-3.863B
Peer Group Low
14.17B
Peer Group High
Date Unavailable
Risk
Performance Versus Peer Group
Annual Total Returns Versus Peers
As of June 08, 2026.
Asset Allocation
As of March 31, 2026.
| Type | % Net |
|---|---|
| Cash | 0.88% |
| Stock | 99.55% |
| Bond | 0.27% |
| Convertible | 0.00% |
| Preferred | 0.00% |
| Other | -0.70% |
Top 3 Holdings
| Name | % Weight | Price | % Change |
|---|---|---|---|
|
Fiera Global Equity Series A
|
100.1% | -- | -- |
|
Other Assets less Liabilities
|
-0.00% | -- | -- |
|
CAD Cash
|
-0.11% | -- | -- |
Fees & Availability
| Fees | |
| Actual 12B-1 Fee | -- |
| Actual Management Fee | -- |
| Administration Fee | -- |
| Maximum Front Load | -- |
| Maximum Deferred Load | -- |
| Maximum Redemption Fee | -- |
| General Availability | |
| Available for Insurance Product |
|
| Available for RRSP |
|
| Purchase Details | |
| Open to New Investors |
|
| Minimum Initial Investment | 400.00 None |
| Minimum Subsequent Investment | 40.00 None |
Basic Info
| Investment Strategy | |
| The fundamental investment objective of this fund is to generate long-term capital growth. The fund is invested mainly in the equities of large-cap global companies located outside of Canada. The fund may hold fund units corresponding to the previously mentioned securities. |
| General | |
| Security Type | Insurance Fund |
| Equity Style | -- |
| Broad Asset Class | International Equity |
| Broad Category | Equity |
| Global Peer Group | Equity Global |
| Peer Group | Global Equity |
| Global Macro | Equity Global |
| US Macro | -- |
| YCharts Categorization | -- |
| YCharts Benchmark | -- |
| Prospectus Objective | -- |
| Fund Owner Firm Name | Beneva |
| Broad Asset Class Benchmark Index | |
| ^SPTSX60TR | 100.0% |
Fundamentals
| General | |
| Distribution Yield | -- |
| Dividend Yield TTM (6-5-26) | 0.00% |
| 30-Day SEC Yield | -- |
| 7-Day SEC Yield | -- |
| Number of Holdings | 3 |
| Stock | |
| Weighted Average PE Ratio | 27.97 |
| Weighted Average Price to Sales Ratio | 7.480 |
| Weighted Average Price to Book Ratio | 10.44 |
| Weighted Median ROE | 45.98% |
| Weighted Median ROA | 16.36% |
| ROI (TTM) | 23.84% |
| Return on Investment (TTM) | 23.84% |
| Earning Yield | 0.0372 |
| LT Debt / Shareholders Equity | 0.6933 |
| Number of Equity Holdings | 0 |
As of March 31, 2026
Growth Metrics
| EPS Growth (1Y) | 17.01% |
| EPS Growth (3Y) | 12.70% |
| EPS Growth (5Y) | 18.84% |
| Sales Growth (1Y) | 10.91% |
| Sales Growth (3Y) | 9.44% |
| Sales Growth (5Y) | 12.41% |
| Sales per Share Growth (1Y) | 12.33% |
| Sales per Share Growth (3Y) | 11.08% |
| Operating Cash Flow - Growth Rate (3Y) | 11.94% |
As of March 31, 2026
Fund Details
| Key Dates | |
| Launch Date | 6/13/2016 |
| Last Annual Report Date | 6/30/2025 |
| Last Prospectus Date | -- |
| Attributes | |
| Index Fund | -- |
| Inverse Fund | No |
| Leveraged Fund | -- |
| Fund of Funds | No |
| Currency Hedged Fund | -- |
| Socially Responsible Fund | No |
Top Portfolio Holders
| Name | % Weight |
|---|---|
| Portfolio A | 5.00% |
| Portfolio B | 3.50% |
| Portfolio C | 2.25% |