

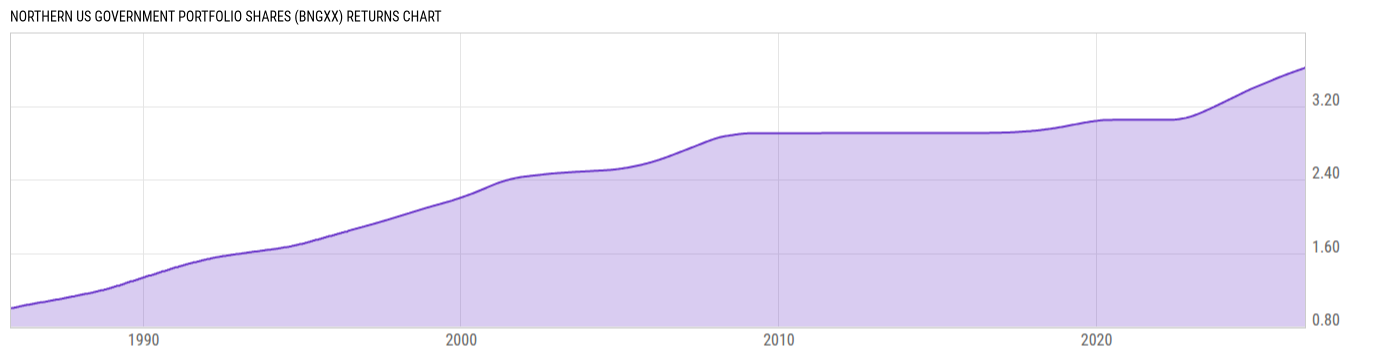
Northern US Government Portfolio Shares (BNGXX)
1.00
0.00 (0.00%)
USD |
Jul 24 2026
Returns Chart
Key Stats
| Net Expense Ratio | Total Assets Under Management | Weighted Average Dividend Yield | Turnover Ratio (Generic) |
|---|---|---|---|
| 0.25% | 22.19B | -- | -- |
| 1 Year Fund Level Flows | 1 Year Total Returns (Daily) | Annualized Total Returns Since Inception (Daily) | Max Drawdown (Since Inception) |
| 966.10M | 3.74% |
Basic Info
| Investment Strategy | |
| The Fund seeks to maximize current income to the extent consistent with the preservation of capital and maintenance of liquidity. Under normal market conditions, The Fund will invest at least 80% of its net assets in U.S. government securities and repurchase agreements collateralized solely by U.S. government securities. |
| General | |
| Security Type | Money Market Fund |
| Equity Style | -- |
| Broad Asset Class | Money Market |
| Broad Category | Capital Preservation |
| Global Peer Group | Money Market USD |
| Peer Group | Instl U.S. Government Money Market Funds |
| Global Macro | Money Market HC |
| US Macro | Taxable Money Market Funds |
| YCharts Categorization | -- |
| YCharts Benchmark | -- |
| Prospectus Objective | Instl U.S. Government Money Market Funds |
| Fund Owner Firm Name | Northern Trust |
| Broad Asset Class Benchmark Index | |
| ^BBUTB13MTR | 100.0% |
Net Fund Flows Versus Peer Group
1 Month
% Rank:
20
-6.717B
Peer Group Low
20.13B
Peer Group High
1 Year
% Rank:
54
966.10M
-3.219B
Peer Group Low
51.05B
Peer Group High
3 Months
% Rank:
67
-4.922B
Peer Group Low
12.05B
Peer Group High
3 Years
% Rank:
48
-12.97B
Peer Group Low
147.08B
Peer Group High
6 Months
% Rank:
32
-15.57B
Peer Group Low
13.75B
Peer Group High
5 Years
% Rank:
59
-18.78B
Peer Group Low
188.36B
Peer Group High
YTD
% Rank:
32
-15.57B
Peer Group Low
13.75B
Peer Group High
10 Years
% Rank:
62
-13.24B
Peer Group Low
337.95B
Peer Group High
Date Unavailable
Risk
Performance Versus Peer Group
Annual Total Returns Versus Peers
As of July 27, 2026.
Asset Allocation
As of June 30, 2026.
| Type | % Net |
|---|---|
| Cash | 50.32% |
| Stock | 0.00% |
| Bond | 49.68% |
| Convertible | 0.00% |
| Preferred | 0.00% |
| Other | 0.00% |
Top 10 Holdings
| Name | % Weight | Price | % Change |
|---|---|---|---|
|
FIXED INCOME CLEARING CORP REPO
|
17.91% | -- | -- |
|
CITIGROUP GLOBAL MARKETS INC REPO
|
16.53% | -- | -- |
|
JP MORGAN SECURITIES LLC REPO
|
7.77% | -- | -- |
|
ROYAL BANK OF CANADA REPO
|
3.15% | -- | -- |
|
GOLDMAN SACHS & CO LLC REPO
|
2.31% | -- | -- |
| United States of America USGB 0.0 12/17/2026 FIX USD Government | 2.17% | 98.47 | 0.04% |
| Federal Home Loan Banks FHLB 0.0 09/16/2026 FIX USD Agency | 1.83% | 99.42 | 0.01% |
| Federal Home Loan Banks FHLB 07/16/2026 FIX USD Agency (Matured) | 1.80% | -- | -- |
| United States of America USGB 0.625 07/31/2026 FIX USD Government | 1.55% | 99.97 | 0.02% |
| United States of America USGB 01/31/2028 FLT USD Government | 1.47% | 100.37 | -0.03% |
Fees & Availability
| Fees | |
| Actual 12B-1 Fee | -- |
| Actual Management Fee | 0.22% |
| Administration Fee | -- |
| Maximum Front Load | -- |
| Maximum Deferred Load | -- |
| Maximum Redemption Fee | -- |
| General Availability | |
| Available for Insurance Product | No |
| Available for RRSP | No |
| Purchase Details | |
| Open to New Investors |
|
| Minimum Initial Investment | 5.00M None |
| Minimum Subsequent Investment | 0.00 None |
Projected Income
| Type | Jul | Aug | Sep | Oct | Nov | Dec | Jan | Feb | Mar | Apr | May | Jun |
|---|---|---|---|---|---|---|---|---|---|---|---|---|
|
Qualified Income
|
-- | -- | -- | -- | -- | -- | -- | -- | -- | -- | -- | -- |
|
Normal
|
-- | -- | -- | -- | -- | -- | -- | -- | -- | -- | -- | -- |
|
Qualified
|
-- | -- | -- | -- | -- | -- | -- | -- | -- | -- | -- | -- |
|
LT Cap Gains
|
-- | -- | -- | -- | -- | -- | -- | -- | -- | -- | -- | -- |
|
Ordinary Income
|
-- | -- | -- | -- | -- | -- | -- | -- | -- | -- | -- | -- |
|
Non-Qual
|
-- | -- | -- | -- | -- | -- | -- | -- | -- | -- | -- | -- |
|
ST Cap Gains
|
-- | -- | -- | -- | -- | -- | -- | -- | -- | -- | -- | -- |
|
Interest
|
-- | -- | -- | -- | -- | -- | -- | -- | -- | -- | -- | -- |
|
Tax-Exempt
|
-- | -- | -- | -- | -- | -- | -- | -- | -- | -- | -- | -- |
|
ROC
|
-- | -- | -- | -- | -- | -- | -- | -- | -- | -- | -- | -- |
|
Other
|
-- | -- | -- | -- | -- | -- | -- | -- | -- | -- | -- | -- |
|
Total
|
-- | -- | -- | -- | -- | -- | -- | -- | -- | -- | -- | -- |
As of June 30, 2026.
Basic Info
| Investment Strategy | |
| The Fund seeks to maximize current income to the extent consistent with the preservation of capital and maintenance of liquidity. Under normal market conditions, The Fund will invest at least 80% of its net assets in U.S. government securities and repurchase agreements collateralized solely by U.S. government securities. |
| General | |
| Security Type | Money Market Fund |
| Equity Style | -- |
| Broad Asset Class | Money Market |
| Broad Category | Capital Preservation |
| Global Peer Group | Money Market USD |
| Peer Group | Instl U.S. Government Money Market Funds |
| Global Macro | Money Market HC |
| US Macro | Taxable Money Market Funds |
| YCharts Categorization | -- |
| YCharts Benchmark | -- |
| Prospectus Objective | Instl U.S. Government Money Market Funds |
| Fund Owner Firm Name | Northern Trust |
| Broad Asset Class Benchmark Index | |
| ^BBUTB13MTR | 100.0% |
Fundamentals
| General | |
| Distribution Yield | -- |
| Dividend Yield TTM (7-24-26) | 3.71% |
| 30-Day SEC Yield | -- |
| 7-Day SEC Yield (6-30-26) | 3.52% |
| Number of Holdings | 10 |
| Bond | |
| Yield to Maturity (6-30-26) | -- |
| Effective Duration | -- |
| Average Coupon | -- |
| Calculated Average Quality | -- |
| Effective Maturity | -- |
| Nominal Maturity | -- |
| Number of Bond Holdings | 5 |
As of June 30, 2026
Fund Details
| Key Dates | |
| Launch Date | 10/29/1985 |
| Last Annual Report Date | 11/30/2025 |
| Last Prospectus Date | 4/1/2025 |
| Attributes | |
| Index Fund | -- |
| Inverse Fund | No |
| Leveraged Fund | -- |
| Fund of Funds | No |
| Currency Hedged Fund | -- |
| Socially Responsible Fund | No |
Top Portfolio Holders
| Name | % Weight |
|---|---|
| Portfolio A | 5.00% |
| Portfolio B | 3.50% |
| Portfolio C | 2.25% |