

State Street Federal Treasury + MM Fd Advantage (ATPXX)
1.00
0.00 (0.00%)
USD |
May 22 2026
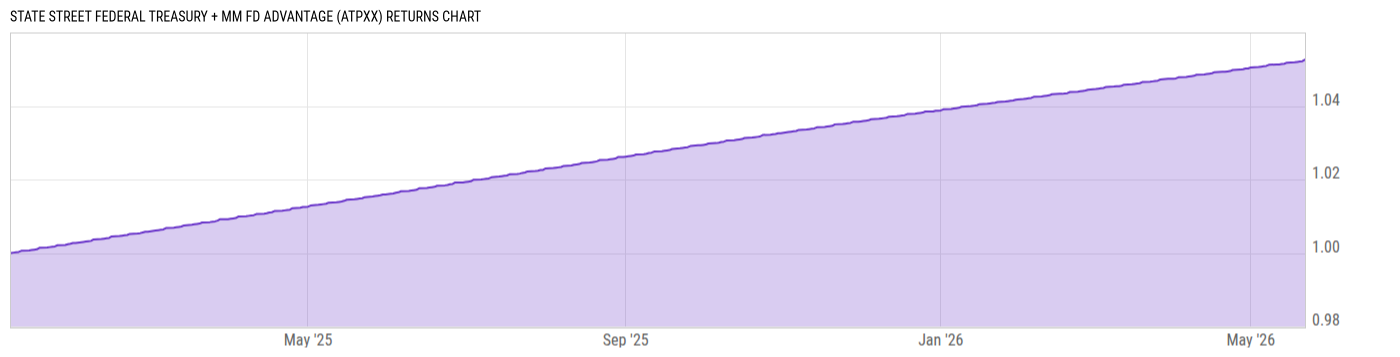
Returns Chart
Key Stats
| Net Expense Ratio | Total Assets Under Management | Weighted Average Dividend Yield | Turnover Ratio (Generic) |
|---|---|---|---|
| 0.39% | 102.15M | -- | -- |
| 1 Year Fund Level Flows | 1 Year Total Returns (Daily) | Annualized Total Returns Since Inception (Daily) | Max Drawdown (Since Inception) |
| 68.70M | 3.71% |
Basic Info
| Investment Strategy | |
| The Fund seeks high level of current income consistent with preserving principal, liquidity & the maintenance of a stable $1.00 per share net asset value. A government money market fund & attempts to meet its investment objective by investing in US Treasury bills, notes, and bonds & repurchase agreements collateralized. |
| General | |
| Security Type | Money Market Fund |
| Equity Style | -- |
| Broad Asset Class | Money Market |
| Broad Category | Capital Preservation |
| Global Peer Group | Money Market USD |
| Peer Group | Instl U.S. Treasury Money Market Funds |
| Global Macro | Money Market HC |
| US Macro | Taxable Money Market Funds |
| YCharts Categorization | -- |
| YCharts Benchmark | -- |
| Prospectus Objective | Instl U.S. Treasury Money Market Funds |
| Fund Owner Firm Name | State Street Investment Management |
| Broad Asset Class Benchmark Index | |
| ^BBUTB13MTR | 100.0% |
Net Fund Flows Versus Peer Group
1 Month
% Rank:
40
-10.61B
Peer Group Low
7.728B
Peer Group High
1 Year
% Rank:
67
68.70M
-4.633B
Peer Group Low
53.88B
Peer Group High
3 Months
% Rank:
46
-6.112B
Peer Group Low
22.08B
Peer Group High
3 Years
% Rank:
70
-13.68B
Peer Group Low
161.08B
Peer Group High
6 Months
% Rank:
67
-14.53B
Peer Group Low
25.51B
Peer Group High
5 Years
% Rank:
73
-17.19B
Peer Group Low
182.12B
Peer Group High
YTD
% Rank:
47
-10.15B
Peer Group Low
22.08B
Peer Group High
10 Years
% Rank:
94
-4.795B
Peer Group Low
262.36B
Peer Group High
Date Unavailable
Risk
Performance Versus Peer Group
Annual Total Returns Versus Peers
As of May 24, 2026.
Asset Allocation
As of December 31, 2025.
| Type | % Net |
|---|---|
| Cash | 0.00% |
| Stock | 0.00% |
| Bond | 0.00% |
| Convertible | 0.00% |
| Preferred | 0.00% |
| Other | 100.0% |
Top 2 Holdings
| Name | % Weight | Price | % Change |
|---|---|---|---|
|
State Street Treasury Plus Money Market Portfolio
|
99.55% | -- | -- |
|
Other Assets less Liabilities
|
0.45% | -- | -- |
Fees & Availability
| Fees | |
| Actual 12B-1 Fee | -- |
| Actual Management Fee | 0.05% |
| Administration Fee | 54.36K% |
| Maximum Front Load | -- |
| Maximum Deferred Load | -- |
| Maximum Redemption Fee | -- |
| General Availability | |
| Available for Insurance Product | No |
| Available for RRSP | No |
| Purchase Details | |
| Open to New Investors |
|
| Minimum Initial Investment | 1.00M None |
| Minimum Subsequent Investment | 0.00 None |
Basic Info
| Investment Strategy | |
| The Fund seeks high level of current income consistent with preserving principal, liquidity & the maintenance of a stable $1.00 per share net asset value. A government money market fund & attempts to meet its investment objective by investing in US Treasury bills, notes, and bonds & repurchase agreements collateralized. |
| General | |
| Security Type | Money Market Fund |
| Equity Style | -- |
| Broad Asset Class | Money Market |
| Broad Category | Capital Preservation |
| Global Peer Group | Money Market USD |
| Peer Group | Instl U.S. Treasury Money Market Funds |
| Global Macro | Money Market HC |
| US Macro | Taxable Money Market Funds |
| YCharts Categorization | -- |
| YCharts Benchmark | -- |
| Prospectus Objective | Instl U.S. Treasury Money Market Funds |
| Fund Owner Firm Name | State Street Investment Management |
| Broad Asset Class Benchmark Index | |
| ^BBUTB13MTR | 100.0% |
Fundamentals
| General | |
| Distribution Yield | -- |
| Dividend Yield TTM (5-22-26) | 3.66% |
| 30-Day SEC Yield | -- |
| 7-Day SEC Yield (4-30-26) | 3.33% |
| Number of Holdings | 2 |
Fund Details
| Key Dates | |
| Launch Date | 1/6/2025 |
| Last Annual Report Date | 12/31/2025 |
| Last Prospectus Date | 8/9/2024 |
| Attributes | |
| Index Fund | -- |
| Inverse Fund | No |
| Leveraged Fund | -- |
| Fund of Funds |
|
| Currency Hedged Fund | -- |
| Socially Responsible Fund | No |
Top Portfolio Holders
| Name | % Weight |
|---|---|
| Portfolio A | 5.00% |
| Portfolio B | 3.50% |
| Portfolio C | 2.25% |