

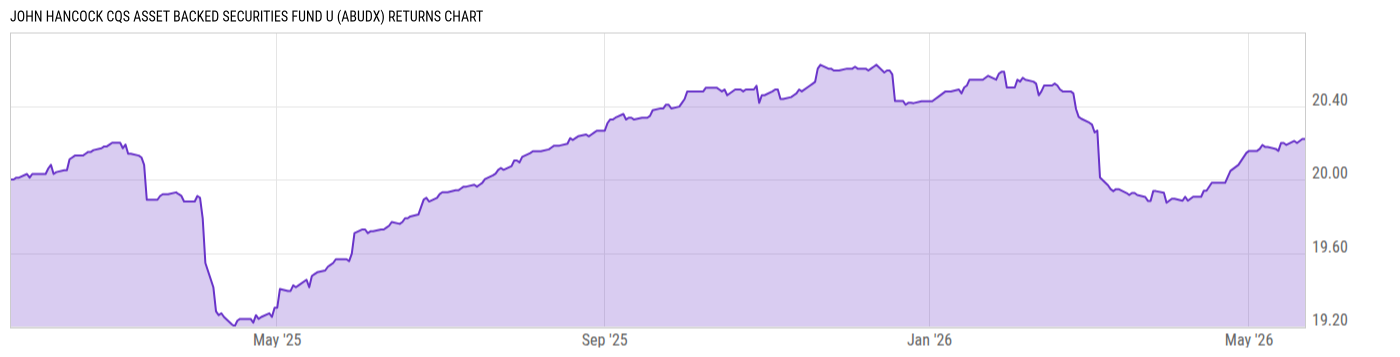
John Hancock CQS Asset Backed Securities Fund U (ABUDX)
18.65
+0.01
(+0.05%)
USD |
May 21 2026
Returns Chart
Key Stats
| Net Expense Ratio | Total Assets Under Management | Weighted Average Dividend Yield | Turnover Ratio (Generic) |
|---|---|---|---|
| 4.97% | 112.00M | -- | 13.00% |
| 1 Year Fund Level Flows | 1 Year Total Returns (Daily) | Annualized Total Returns Since Inception (Daily) | Max Drawdown (Since Inception) |
| -- | 3.51% |
Basic Info
| Investment Strategy | |
| The Fund seeks to generate a return comprised of both current income and capital appreciation. The fund is a non-diversified fund. Under normal market conditions, it invests at least 80% of its net assets, plus any borrowings for investment purposes, in asset-backed securities - related investments. |
| General | |
| Security Type | Unlisted Closed-End Fund |
| Equity Style | -- |
| Broad Asset Class | Taxable Bond |
| Broad Category | Fixed Income |
| Global Peer Group | Bond Global USD |
| Peer Group | General Bond Funds |
| Global Macro | Bond Global |
| US Macro | General Domestic Taxable Fixed Income Funds |
| YCharts Categorization | -- |
| YCharts Benchmark | -- |
| Prospectus Objective | General Bond Funds |
| Fund Owner Firm Name | John Hancock Group |
| Broad Asset Class Benchmark Index | |
| ^BBUSATR | 100.0% |
Net Fund Flows Versus Peer Group
1 Month
% Rank:
--
-3.511B
Peer Group Low
288.35M
Peer Group High
1 Year
% Rank:
--
-641.24M
Peer Group Low
13.23B
Peer Group High
3 Months
% Rank:
--
-2.235B
Peer Group Low
1.456B
Peer Group High
3 Years
% Rank:
--
-12.70B
Peer Group Low
18.00B
Peer Group High
6 Months
% Rank:
--
-3.509B
Peer Group Low
2.976B
Peer Group High
5 Years
% Rank:
--
-1.455B
Peer Group Low
49.86B
Peer Group High
YTD
% Rank:
--
-2.080B
Peer Group Low
2.002B
Peer Group High
10 Years
% Rank:
--
-1.866B
Peer Group Low
81.23B
Peer Group High
Date Unavailable
Risk
Performance Versus Peer Group
Annual Total Returns Versus Peers
As of May 22, 2026.
Asset Allocation
As of February 28, 2026.
| Type | % Net |
|---|---|
| Cash | -30.16% |
| Stock | 0.00% |
| Bond | 129.6% |
| Convertible | 0.00% |
| Preferred | 0.00% |
| Other | 0.58% |
Top 10 Holdings
| Name | % Weight | Price | % Change |
|---|---|---|---|
| State Street US Government Money Market Fund Prem | 19.14% | 1.00 | 0.00% |
|
USD Cash
|
3.43% | -- | -- |
|
CVC CORDATUS LOAN FUND DAC 26R FR SEQ FLT 10.356% 15-JAN-2038
|
3.28% | -- | -- |
|
Trafalgar Finance Designated Activity Co FRN 9.879% 30-Apr-2047
|
3.18% | -- | -- |
|
FREDDIE MAC STACR REMIC TRUST 21HQA1 B2 FLT 8.69728% 25-AUG-2033
|
3.17% | -- | -- |
|
CARLYLE EURO CLO DAC 251 A1 SEQ FLT 3.22326% 16-AUG-2038
|
3.17% | -- | -- |
|
CARLYLE GLOBAL MARKET STRATEGIES EURO CLO LIMITED 152RR ER SEQ FLT 11.008% 10-NOV-2035
|
3.11% | -- | -- |
| FREDDIE MAC STACR REMIC TRUST 2020-HQA3 FREDMACK 08/25/2033 N/A Corporate 144A | 3.06% | 123.50 | -0.02% |
|
FREDDIE MAC STACR REMIC TRUST 21DNA1 B2 FLT 8.41721% 25-JAN-2051
|
3.00% | -- | -- |
|
FREDDIE MAC STACR REMIC TRUST 20HQA5 B2 FLT 11.09728% 25-NOV-2050
|
3.00% | -- | -- |
Fees & Availability
| Fees | |
| Actual 12B-1 Fee | 0.75% |
| Actual Management Fee | 1.05% |
| Administration Fee | -- |
| Maximum Front Load | -- |
| Maximum Deferred Load | -- |
| Maximum Redemption Fee | -- |
| General Availability | |
| Available for Insurance Product | No |
| Available for RRSP | No |
| Purchase Details | |
| Open to New Investors |
|
| Minimum Initial Investment | 1000.00 None |
| Minimum Subsequent Investment | 0.00 None |
Basic Info
| Investment Strategy | |
| The Fund seeks to generate a return comprised of both current income and capital appreciation. The fund is a non-diversified fund. Under normal market conditions, it invests at least 80% of its net assets, plus any borrowings for investment purposes, in asset-backed securities - related investments. |
| General | |
| Security Type | Unlisted Closed-End Fund |
| Equity Style | -- |
| Broad Asset Class | Taxable Bond |
| Broad Category | Fixed Income |
| Global Peer Group | Bond Global USD |
| Peer Group | General Bond Funds |
| Global Macro | Bond Global |
| US Macro | General Domestic Taxable Fixed Income Funds |
| YCharts Categorization | -- |
| YCharts Benchmark | -- |
| Prospectus Objective | General Bond Funds |
| Fund Owner Firm Name | John Hancock Group |
| Broad Asset Class Benchmark Index | |
| ^BBUSATR | 100.0% |
Fundamentals
| General | |
| Distribution Yield | -- |
| Dividend Yield TTM (5-20-26) | 6.97% |
| 30-Day SEC Yield | -- |
| 7-Day SEC Yield | -- |
| Number of Holdings | 86 |
| Bond | |
| Yield to Maturity (2-28-26) | 8.44% |
| Effective Duration | 3.80 |
| Average Coupon | 8.68% |
| Calculated Average Quality | 4.257 |
| Effective Maturity | 16.30 |
| Nominal Maturity | 16.30 |
| Number of Bond Holdings | 72 |
As of February 28, 2026
Fund Details
Top Portfolio Holders
| Name | % Weight |
|---|---|
| Portfolio A | 5.00% |
| Portfolio B | 3.50% |
| Portfolio C | 2.25% |