

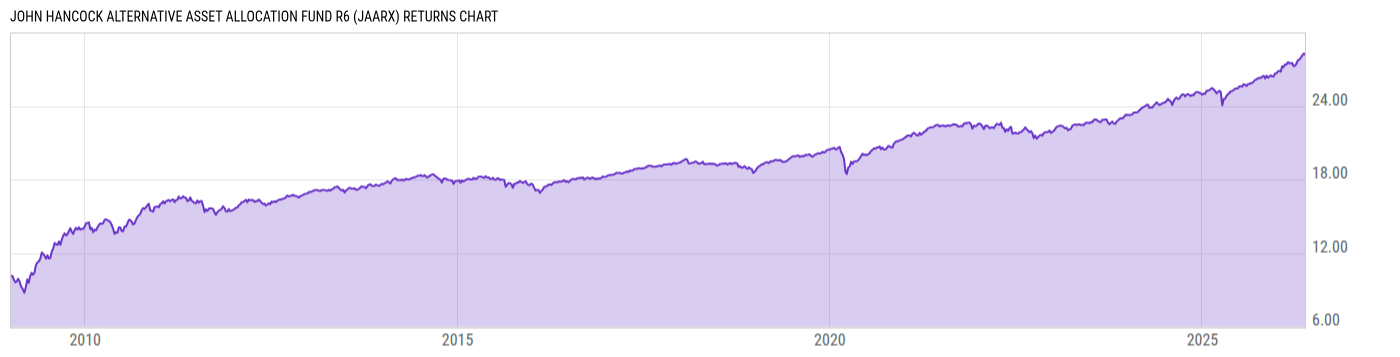
John Hancock Alternative Asset Allocation Fund R6 (JAARX)
17.70
+0.01
(+0.06%)
USD |
May 26 2026
Returns Chart
Key Stats
| Net Expense Ratio | Total Assets Under Management | Weighted Average Dividend Yield | Turnover Ratio (Generic) |
|---|---|---|---|
| 1.29% | 1.620B | -- | 33.00% |
| 1 Year Fund Level Flows | 1 Year Total Returns (Daily) | Annualized Total Returns Since Inception (Daily) | Max Drawdown (Since Inception) |
| 448.54M | 12.39% |
Basic Info
| Investment Strategy | |
| The Fund seeks long-term growth of capital. The Fund is a fund of funds which invests its assets in underlying funds that invest in alternative assets, including international small cap stocks, emerging market equity, commodities, market neutral, global real estate, natural resources, TIPs, global bonds, and others. |
| General | |
| Security Type | Mutual Fund |
| Equity Style | -- |
| Broad Asset Class | Alternative |
| Broad Category | Alternative Strategies |
| Global Peer Group | Alternative Multi Strategies |
| Peer Group | Alternative Multi-Strategy Funds |
| Global Macro | Liquid Alternatives |
| US Macro | Alternative Equity Funds |
| YCharts Categorization | -- |
| YCharts Benchmark | -- |
| Prospectus Objective | Alternative Multi-Strategy Funds |
| Fund Owner Firm Name | John Hancock Group |
| Broad Asset Class Benchmark Index | |
| ^MSACWINTR | 100.0% |
Net Fund Flows Versus Peer Group
1 Month
% Rank:
82
-57.14M
Peer Group Low
449.76M
Peer Group High
1 Year
% Rank:
10
448.54M
-552.08M
Peer Group Low
4.649B
Peer Group High
3 Months
% Rank:
22
-220.49M
Peer Group Low
1.193B
Peer Group High
3 Years
% Rank:
9
-1.806B
Peer Group Low
6.229B
Peer Group High
6 Months
% Rank:
7
-247.22M
Peer Group Low
2.749B
Peer Group High
5 Years
% Rank:
15
-2.319B
Peer Group Low
6.492B
Peer Group High
YTD
% Rank:
23
-183.82M
Peer Group Low
2.170B
Peer Group High
10 Years
% Rank:
30
-3.287B
Peer Group Low
6.881B
Peer Group High
Date Unavailable
Risk
Performance Versus Peer Group
Annual Total Returns Versus Peers
As of May 27, 2026.
Asset Allocation
As of March 31, 2026.
| Type | % Net |
|---|---|
| Cash | 18.41% |
| Stock | 56.58% |
| Bond | 21.23% |
| Convertible | 0.05% |
| Preferred | 0.63% |
| Other | 3.10% |
Top 10 Holdings
| Name | % Weight | Price | % Change |
|---|---|---|---|
| JPMorgan Hedged Equity Fund R6 | 13.68% | 34.76 | 0.06% |
| Calamos Market Neutral Income Fund I | 12.94% | 16.12 | 0.12% |
| John Hancock Multi-Asset Absolute Return Fund NAV | 11.33% | 10.94 | 0.46% |
| BlackRock Tactical Opportunities Fund Inst | 10.64% | 17.31 | -0.06% |
| Victory Market Neutral Income Fund I | 9.94% | 9.32 | 0.00% |
| John Hancock Diversified Macro Fund NAV | 8.00% | 9.16 | -0.11% |
| John Hancock Disciplined Value Global Lg/Sh Fd NAV | 7.56% | 18.07 | 0.17% |
| Arbitrage Fund I | 7.54% | 14.20 | 0.07% |
| Virtus AlphaSimplex Mgd Futures Strategy Fund R6 | 5.77% | 8.78 | -0.68% |
| John Hancock Infrastructure Fund NAV | 3.77% | 19.89 | 0.00% |
Fees & Availability
| Fees | |
| Actual 12B-1 Fee | -- |
| Actual Management Fee | 0.31% |
| Administration Fee | -- |
| Maximum Front Load | -- |
| Maximum Deferred Load | -- |
| Maximum Redemption Fee | -- |
| General Availability | |
| Available for Insurance Product | No |
| Available for RRSP | No |
| Purchase Details | |
| Open to New Investors |
|
| Minimum Initial Investment | 1.00M None |
| Minimum Subsequent Investment | 0.00 None |
Basic Info
| Investment Strategy | |
| The Fund seeks long-term growth of capital. The Fund is a fund of funds which invests its assets in underlying funds that invest in alternative assets, including international small cap stocks, emerging market equity, commodities, market neutral, global real estate, natural resources, TIPs, global bonds, and others. |
| General | |
| Security Type | Mutual Fund |
| Equity Style | -- |
| Broad Asset Class | Alternative |
| Broad Category | Alternative Strategies |
| Global Peer Group | Alternative Multi Strategies |
| Peer Group | Alternative Multi-Strategy Funds |
| Global Macro | Liquid Alternatives |
| US Macro | Alternative Equity Funds |
| YCharts Categorization | -- |
| YCharts Benchmark | -- |
| Prospectus Objective | Alternative Multi-Strategy Funds |
| Fund Owner Firm Name | John Hancock Group |
| Broad Asset Class Benchmark Index | |
| ^MSACWINTR | 100.0% |
Fundamentals
| General | |
| Distribution Yield | -- |
| Dividend Yield TTM (5-26-26) | 1.81% |
| 30-Day SEC Yield | -- |
| 7-Day SEC Yield | -- |
| Number of Holdings | 17 |
| Stock | |
| Weighted Average PE Ratio | 28.16 |
| Weighted Average Price to Sales Ratio | 6.208 |
| Weighted Average Price to Book Ratio | 7.631 |
| Weighted Median ROE | 64.39% |
| Weighted Median ROA | 11.03% |
| ROI (TTM) | 18.10% |
| Return on Investment (TTM) | 18.10% |
| Earning Yield | 0.0477 |
| LT Debt / Shareholders Equity | 0.9050 |
| Number of Equity Holdings | 0 |
| Bond | |
| Yield to Maturity (3-31-26) | 2.25% |
| Effective Duration | -- |
| Average Coupon | 3.78% |
| Calculated Average Quality | 3.148 |
| Effective Maturity | 4.263 |
| Nominal Maturity | 4.388 |
| Number of Bond Holdings | 0 |
As of March 31, 2026
Growth Metrics
| EPS Growth (1Y) | 22.52% |
| EPS Growth (3Y) | 13.64% |
| EPS Growth (5Y) | 17.94% |
| Sales Growth (1Y) | 12.15% |
| Sales Growth (3Y) | 9.62% |
| Sales Growth (5Y) | 12.54% |
| Sales per Share Growth (1Y) | 14.06% |
| Sales per Share Growth (3Y) | 9.91% |
| Operating Cash Flow - Growth Rate (3Y) | 19.04% |
As of March 31, 2026
Fund Details
| Key Dates | |
| Inception Date | 1/2/2009 |
| Last Annual Report Date | 8/31/2025 |
| Last Prospectus Date | 1/1/2026 |
| Share Classes | |
| JAAAX | A |
| JAACX | C |
| JAAIX | Inst |
| JAAPX | Retirement |
| JAASX | Retirement |
| Attributes | |
| Index Fund | -- |
| Inverse Fund | No |
| Leveraged Fund | -- |
| Fund of Funds |
|
| Currency Hedged Fund | -- |
| Socially Responsible Fund | No |
Top Portfolio Holders
| Name | % Weight |
|---|---|
| Portfolio A | 5.00% |
| Portfolio B | 3.50% |
| Portfolio C | 2.25% |
Excel Add-In Codes
| Name: =YCI("M:JAARX", "name") |
| Broad Asset Class: =YCI("M:JAARX", "broad_asset_class") |
| Broad Category: =YCI("M:JAARX", "broad_category_group") |
| Prospectus Objective: =YCI("M:JAARX", "prospectus_objective") |
| To find the codes for any of our securities and financial metrics, see our Complete Excel Reference. |