

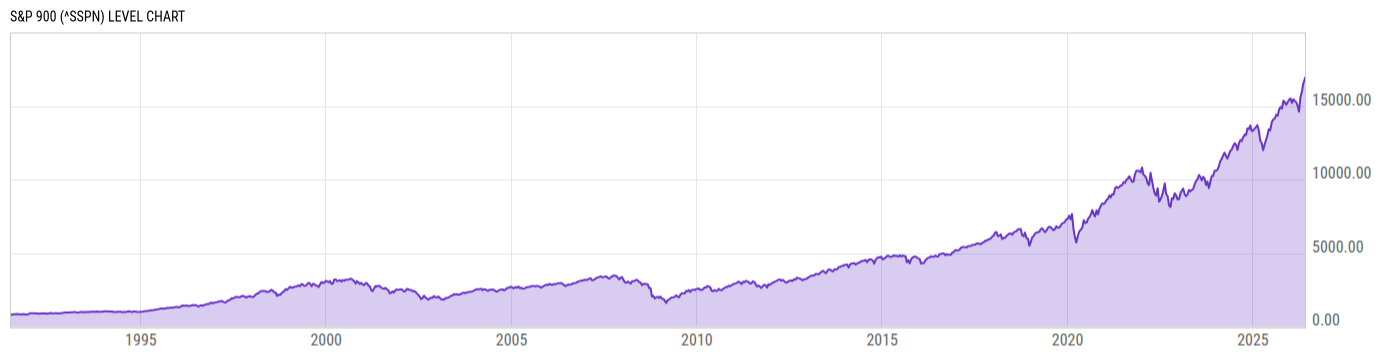
S&P 900 (^SSPN)
16998.96
+74.34
(+0.44%)
USD |
Jun 01, 13:57
Level Chart
Key Stats
Basic Info
| The S&P 500, or just the S&P, is an American stock market index based on the market capitalizations of 500 large companies having common stock listed on the NYSE, NASDAQ, or the Cboe BZX Exchange. | |
| Core Index Name | S&P 900 |
| Return Type | Price Return |
| Currency Code | USD |
| Category Hedge Type | Not Hedged |
Index Varieties
| Return Types | |
| Total Return | S&P 900 Total Return |
Total Return Performance
As of May 29, 2026.
Returns for periods of 1 year and above are annualized.
Annual Performance
As of June 01, 2026.
Basic Info
| The S&P 500, or just the S&P, is an American stock market index based on the market capitalizations of 500 large companies having common stock listed on the NYSE, NASDAQ, or the Cboe BZX Exchange. | |
| Core Index Name | S&P 900 |
| Return Type | Price Return |
| Currency Code | USD |
| Category Hedge Type | Not Hedged |
Index Varieties
| Return Types | |
| Total Return | S&P 900 Total Return |