

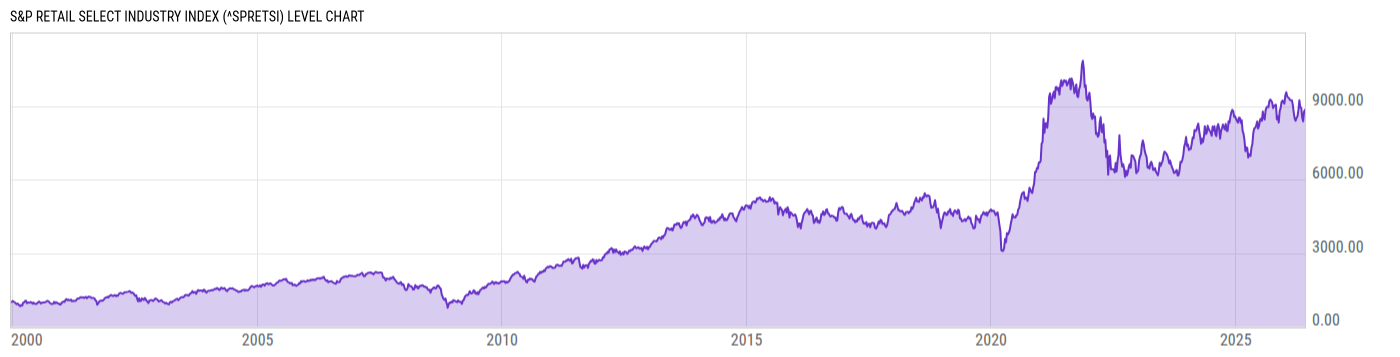
S&P Retail Select Industry Index (^SPRETSI)
8849.89
+39.28
(+0.45%)
USD |
Jun 02, 20:00
Level Chart
Key Stats
Basic Info
| N/A | |
| Core Index Name | S&P Retail Select Industry Index |
| Return Type | Price Return |
| Currency Code | USD |
| Category Hedge Type | Not Hedged |
Index Varieties
| Return Types | |
| Net Total Return | S&P Retail Select Industry Index Net Total Return |
| Total Return | S&P Retail Select Industry Index Total Return |
Total Return Performance
As of June 01, 2026.
Returns for periods of 1 year and above are annualized.
Annual Performance
As of June 02, 2026.
Basic Info
| N/A | |
| Core Index Name | S&P Retail Select Industry Index |
| Return Type | Price Return |
| Currency Code | USD |
| Category Hedge Type | Not Hedged |
Index Varieties
| Return Types | |
| Net Total Return | S&P Retail Select Industry Index Net Total Return |
| Total Return | S&P Retail Select Industry Index Total Return |