

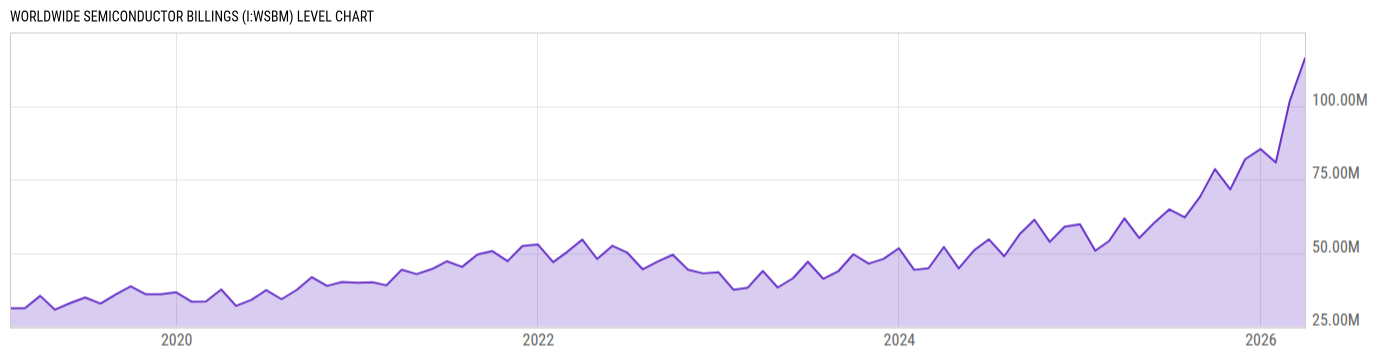
Worldwide Semiconductor Billings (I:WSBM)
116.21M USD for Mar 2026
Level Chart
Basic Info
|
Worldwide Semiconductor Billings is at a current level of 116.21M, up from 101.56M last month and up from 61.77M one year ago. This is a change of 14.43% from last month and 88.13% from one year ago. |
| Report | WSTS Historical Billings Report |
| Category | Manufacturing Business Statistics |
| Region | United States |
| Source | World Semiconductor Trade Statistics |
Stats
| Last Value | 116.21M |
| Latest Period | Mar 2026 |
| Last Updated | May 8 2026, 09:04 EDT |
| Next Release | Jun 2 2026, 10:00 EDT |
| Average Growth Rate | 23.87% |
| Value from Last Month | 101.56M |
| Change from Last Month | 14.43% |
| Value from 1 Year Ago | 61.77M |
| Change from 1 Year Ago | 88.13% |
| Frequency | Monthly |
| Unit | USD |
| Adjustment | N/A |
| Download Source File |
Historical Data
| Date | Value |
|---|---|
| March 31, 2026 | 116.21M |
| February 28, 2026 | 101.56M |
| January 31, 2026 | 80.78M |
| December 31, 2025 | 85.35M |
| November 30, 2025 | 81.88M |
| October 31, 2025 | 71.65M |
| September 30, 2025 | 78.52M |
| August 31, 2025 | 69.17M |
| July 31, 2025 | 62.10M |
| June 30, 2025 | 64.86M |
| May 31, 2025 | 60.40M |
| April 30, 2025 | 55.09M |
| March 31, 2025 | 61.77M |
| February 28, 2025 | 54.07M |
| January 31, 2025 | 50.77M |
| December 31, 2024 | 59.81M |
| November 30, 2024 | 58.95M |
| October 31, 2024 | 53.80M |
| September 30, 2024 | 61.31M |
| August 31, 2024 | 56.35M |
| July 31, 2024 | 48.89M |
| June 30, 2024 | 54.66M |
| May 31, 2024 | 50.88M |
| April 30, 2024 | 44.76M |
| March 31, 2024 | 52.05M |
| Date | Value |
|---|---|
| February 29, 2024 | 44.82M |
| January 31, 2024 | 44.26M |
| December 31, 2023 | 51.62M |
| November 30, 2023 | 47.99M |
| October 31, 2023 | 46.38M |
| September 30, 2023 | 49.57M |
| August 31, 2023 | 43.87M |
| July 31, 2023 | 41.24M |
| June 30, 2023 | 47.04M |
| May 31, 2023 | 41.41M |
| April 30, 2023 | 38.26M |
| March 31, 2023 | 43.89M |
| February 28, 2023 | 38.16M |
| January 31, 2023 | 37.46M |
| December 31, 2022 | 43.48M |
| November 30, 2022 | 43.07M |
| October 31, 2022 | 44.27M |
| September 30, 2022 | 49.40M |
| August 31, 2022 | 47.16M |
| July 31, 2022 | 44.46M |
| June 30, 2022 | 50.10M |
| May 31, 2022 | 52.45M |
| April 30, 2022 | 47.96M |
| March 31, 2022 | 54.55M |
| February 28, 2022 | 50.31M |
News
Headline
Time (ET)
05/15 15:48
05/13 07:45
Basic Info
|
Worldwide Semiconductor Billings is at a current level of 116.21M, up from 101.56M last month and up from 61.77M one year ago. This is a change of 14.43% from last month and 88.13% from one year ago. |
| Report | WSTS Historical Billings Report |
| Category | Manufacturing Business Statistics |
| Region | United States |
| Source | World Semiconductor Trade Statistics |
Stats
| Last Value | 116.21M |
| Latest Period | Mar 2026 |
| Last Updated | May 8 2026, 09:04 EDT |
| Next Release | Jun 2 2026, 10:00 EDT |
| Average Growth Rate | 23.87% |
| Value from Last Month | 101.56M |
| Change from Last Month | 14.43% |
| Value from 1 Year Ago | 61.77M |
| Change from 1 Year Ago | 88.13% |
| Frequency | Monthly |
| Unit | USD |
| Adjustment | N/A |
| Download Source File |