

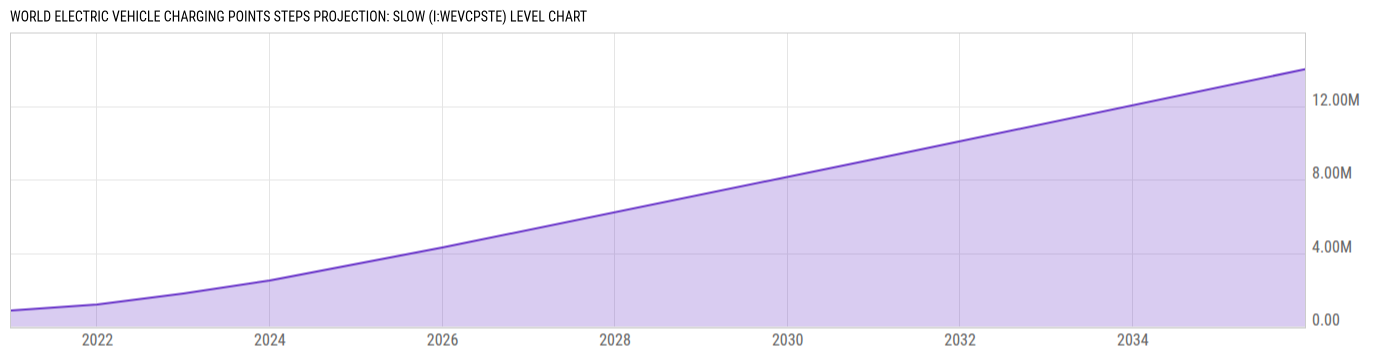
World Electric Vehicle Charging Points STEPS Projection: Slow (I:WEVCPSTE)
14.00M for 2035
Level Chart
Basic Info
|
World Electric Vehicle Charging Points STEPS Projection: Slow is at a current level of 14.00M, up from 9.10M one year ago. This is a change of 53.85% from one year ago. |
| Report | Global Electric Vehicle Outlook |
| Categories | Public Health , Transportation |
| Region | World |
| Source | International Energy Agency (IEA) |
Stats
| Last Value | 14.00M |
| Latest Period | 2035 |
| Last Updated | Apr 25 2024, 08:37 EDT |
| Next Release | May 15 2027, 18:00 EDT (E) |
| Average Growth Rate | 60.72% |
| Value from 1 Year Ago | 9.10M |
| Change from 1 Year Ago | 53.85% |
| Frequency | Yearly |
| Adjustment | N/A |
| Download Source File |
Historical Data
| Date | Value |
|---|---|
| December 31, 2035 | 14.00M |
| December 31, 2030 | 9.10M |
| December 31, 2025 | 4.30M |
| December 31, 2023 | 2.50M |
| Date | Value |
|---|---|
| December 31, 2022 | 1.80M |
| December 31, 2021 | 1.20M |
| December 31, 2020 | 870000.0 |
News
Headline
Time (ET)
05/12 10:37
Basic Info
|
World Electric Vehicle Charging Points STEPS Projection: Slow is at a current level of 14.00M, up from 9.10M one year ago. This is a change of 53.85% from one year ago. |
| Report | Global Electric Vehicle Outlook |
| Categories | Public Health , Transportation |
| Region | World |
| Source | International Energy Agency (IEA) |
Stats
| Last Value | 14.00M |
| Latest Period | 2035 |
| Last Updated | Apr 25 2024, 08:37 EDT |
| Next Release | May 15 2027, 18:00 EDT (E) |
| Average Growth Rate | 60.72% |
| Value from 1 Year Ago | 9.10M |
| Change from 1 Year Ago | 53.85% |
| Frequency | Yearly |
| Adjustment | N/A |
| Download Source File |